Markets
The Demographic Timebomb: A Rapidly Aging Population
With record-high amounts of student debt, questionable job prospects, and too much avocado toast in their bellies, many millennials already feel like they are getting the short end of the stick.
But here’s another economic headwind they face as they are coming of age: the percentage of the global population that is 65 or older will double from 10% to 20% by 2050.
As millennials enter their peak earning years, there will be 1.6 billion elderly people on the planet.
Someone Has to Pay the Bill
Today’s infographic comes to us from Aperion Care, and it highlights how demographics are shifting as well as the economic challenges of a rapidly aging global population.
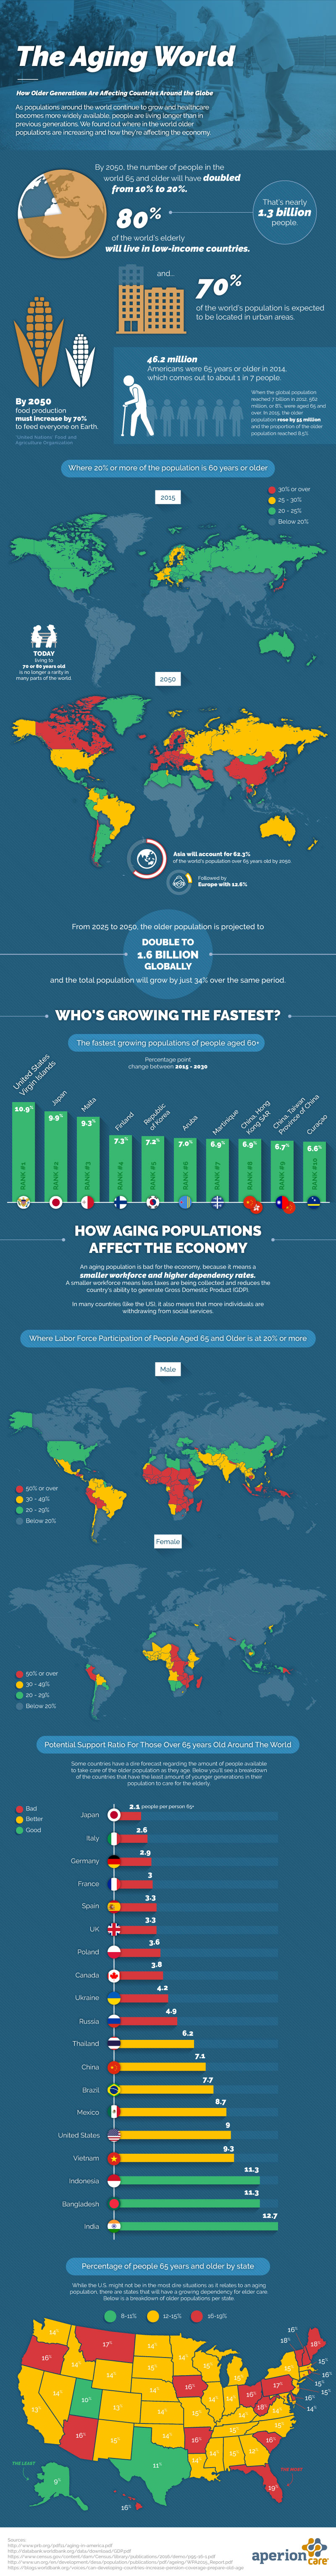
With an older population that works less, support and dependency ratios get out of whack.
After all, countries already spend trillions of dollars each year on healthcare and social security. These systems were designed a long time ago, and were not setup to work with so few people paying into the programs.
Which Countries Face Headwinds?
While most countries face similar obstacles with aging populations, for some the problem is more severe.
The Potential Support Ratio (PSR), a measure of amount of working people (15-64) for each person over 65+ in age, is anticipated to fall below 5.0 in countries like Japan, Italy, Germany, Canada, France, and the United Kingdom. These countries will all have significant portions of their populations (>30%) made up of elderly people by 2050.
The United States sits in a slightly better situation with 27.9% of its population expected to hit 65 or higher by the same year – however, this is still analogous to modern-day Germany (which sits at 27.6%), a country that is already dealing with big demographic issues.
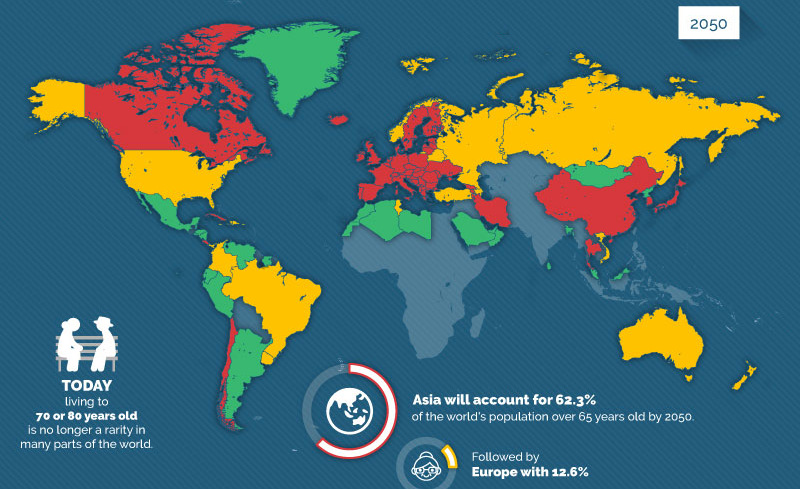
Here’s one other look, from our previous Chart of the Week on dropping fertility rates and global aging:
Will millennials be able to diffuse the demographic timebomb, or will an aging population be the final straw?


Markets
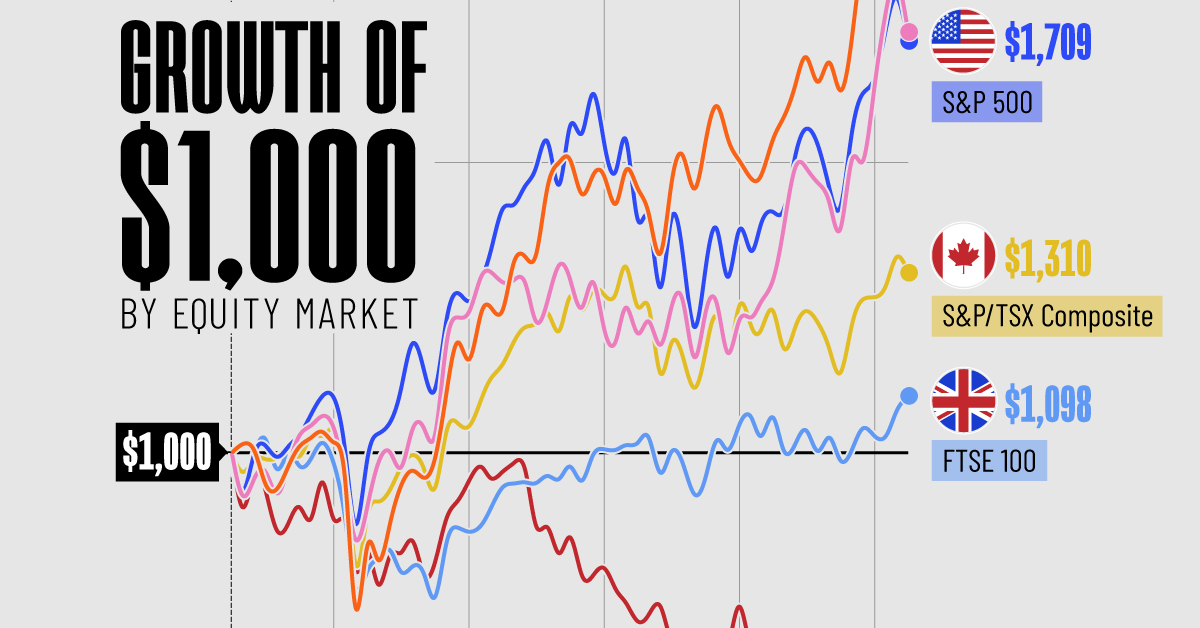
The Growth of a $1,000 Equity Investment, by Stock Market
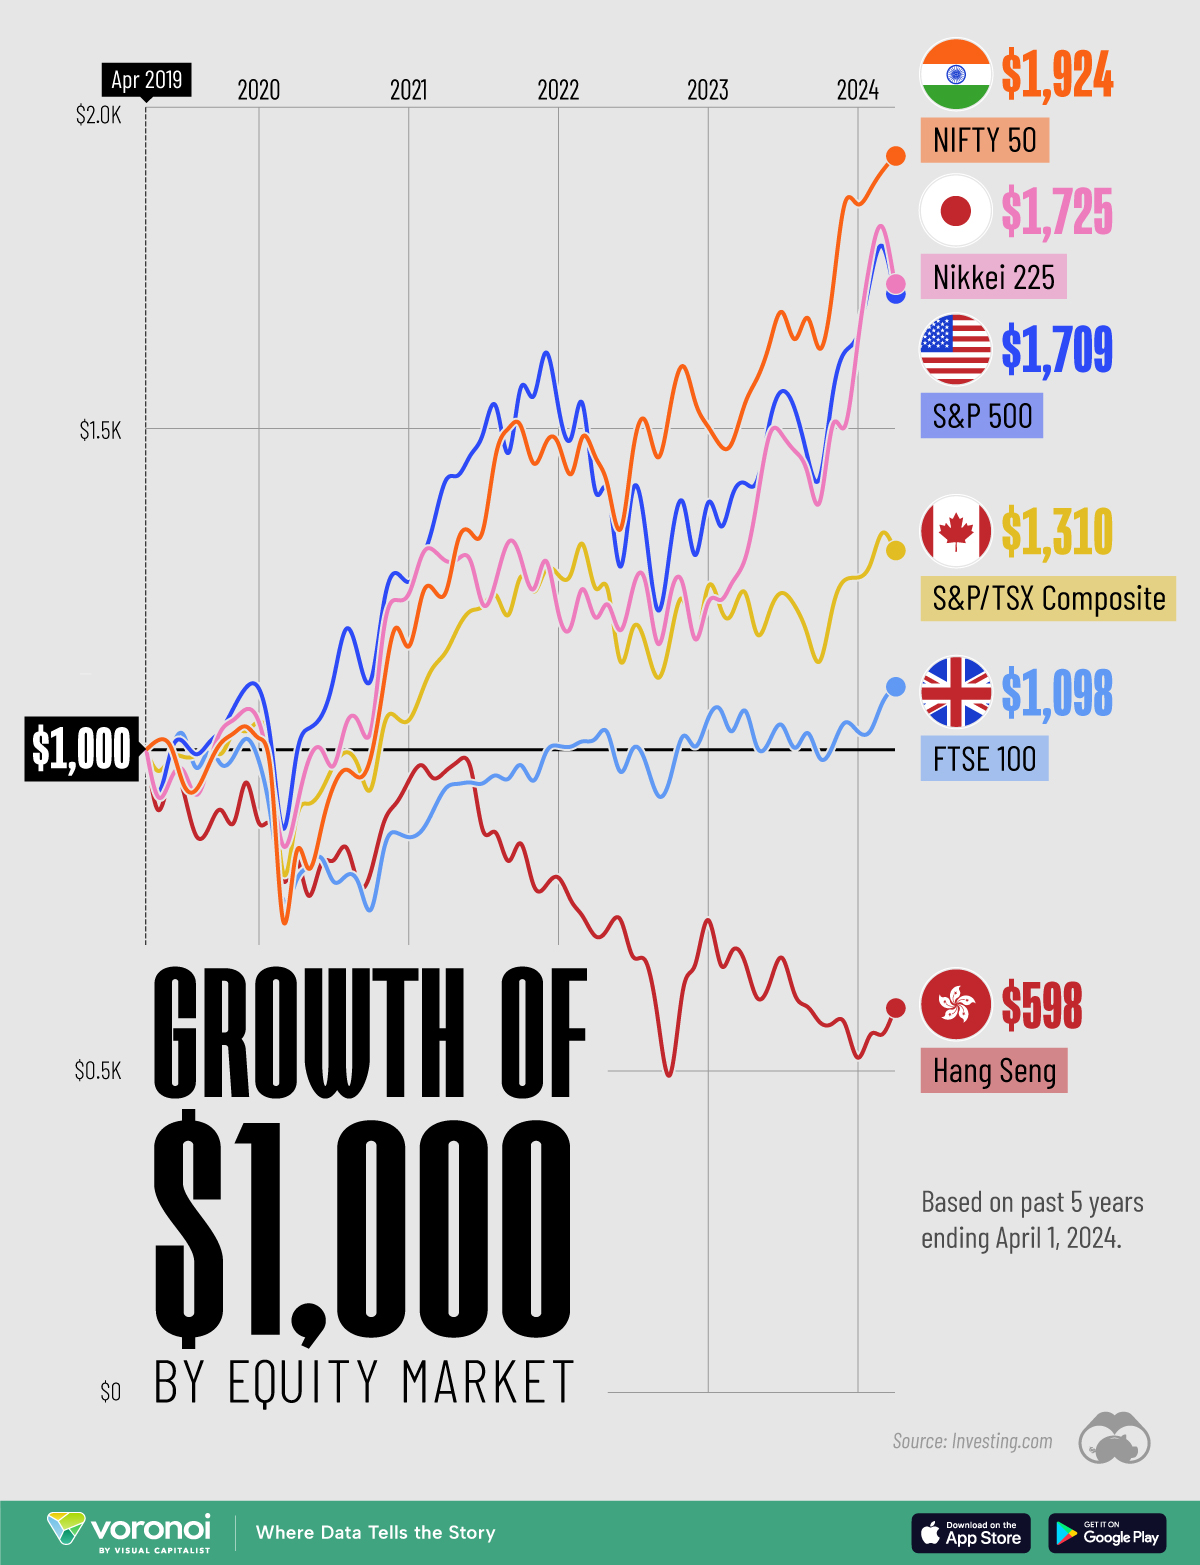
In this graphic, we’ve visualized stock market growth by country over the past five years using major indices.
Visualizing Stock Market Growth by Country
This was originally posted on our Voronoi app. Download the app for free on iOS or Android and discover incredible data-driven charts from a variety of trusted sources.
In this graphic, we show the change in value of a $1,000 investment in various leading equity indexes from around the world. This data was sourced from Investing.com, and covers a five-year period from April 2019 to April 2024.
See the following table for the five-year annual return figures of the indexes shown above.
| Index | 5-Yr Return as of April 1, 2024 |
|---|---|
| 🇮🇳 NIFTY 50 | 92.4% |
| 🇯🇵 Nikkei 225 | 72.5% |
| 🇺🇸 S&P 500 | 70.9% |
| 🇨🇦 S&P/TSX Composite | 31.0% |
| 🇬🇧 FTSE 100 | 9.8% |
| 🇭🇰 Hang Seng | -40.2% |
In terms of stock market growth by country, India (represented here by the NIFTY 50) has impressively surpassed both the U.S. and Japan.
What is the NIFTY 50?
The NIFTY 50 is an index of the 50 largest and most actively traded Indian stocks. Similar to the S&P 500, it represents a range of industries and acts as a benchmark for investors to gauge the performance of the country’s broader stock market.
What’s Going on in India?
India’s multi-year bull market has led to several records being shattered in 2023. For example, the country’s total stock market market capitalization surpassed $4 trillion for the first time, while India-focused ETFs pulled in net inflows of $8.6 billion over the year.
A primary driver of this growth is the country’s fast-rising middle class. According to a report by Morgan Stanley, this “once-in-a-generation shift” will result in India having the third largest stock market globally by 2030, presumably behind the U.S. and China.
Japan Also Breaks Records
Japanese equities (represented in this graphic by the Nikkei 225) slightly outperformed the S&P 500 over the past five years. The index, which represents the top 225 companies on the Tokyo Stock Exchange, recently set a new record high for the first time since 1989.
Japanese companies have reported strong earnings as of late, partly thanks to a weak yen, which benefits many of the country’s export-reliant companies.
Learn More About Global Markets From Visual Capitalist
If you enjoyed this graphic, be sure to check out The World’s Biggest Stock Markets, by Country, which provides a unique perspective on country-level market capitalizations.

-

 Energy6 days ago
Mapped: The Age of Energy Projects in Interconnection Queues, by State
-

 AI2 weeks ago
Visualizing AI Patents by Country
-

 Markets2 weeks ago
Economic Growth Forecasts for G7 and BRICS Countries in 2024
-

 Wealth2 weeks ago
Charted: Which City Has the Most Billionaires in 2024?
-

 Technology2 weeks ago
All of the Grants Given by the U.S. CHIPS Act
-

 Green1 week ago
The Carbon Footprint of Major Travel Methods
-

 United States1 week ago
Visualizing the Most Common Pets in the U.S.
-

 Culture1 week ago
The World’s Top Media Franchises by All-Time Revenue