Healthcare
Charted: The World’s Aging Population from 1950 to 2100
Article/Editing:
Charted: The World’s Aging Population from 1950 to 2100
As demographics continue to shift in the 21st century, the world’s aging population will continue to be a focal point for many global decision makers.
Most countries around the world have experienced population explosions, or are about to. Combine this with declining birth rates and falling mortality rates, and it’s clear that the global senior population will continue to reach new heights.
These graphics by Pablo Alvarez use data from the 2022 UN World Population Prospects to visualize this increasing aging population across countries.
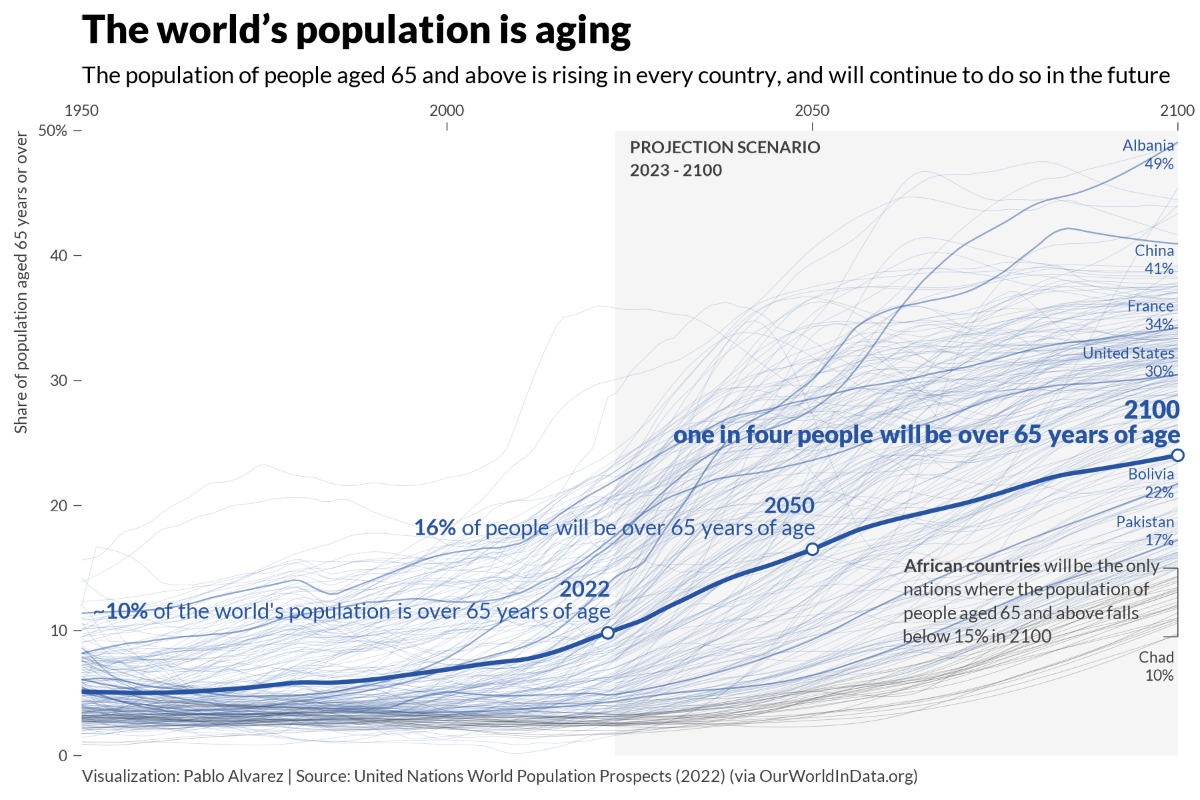
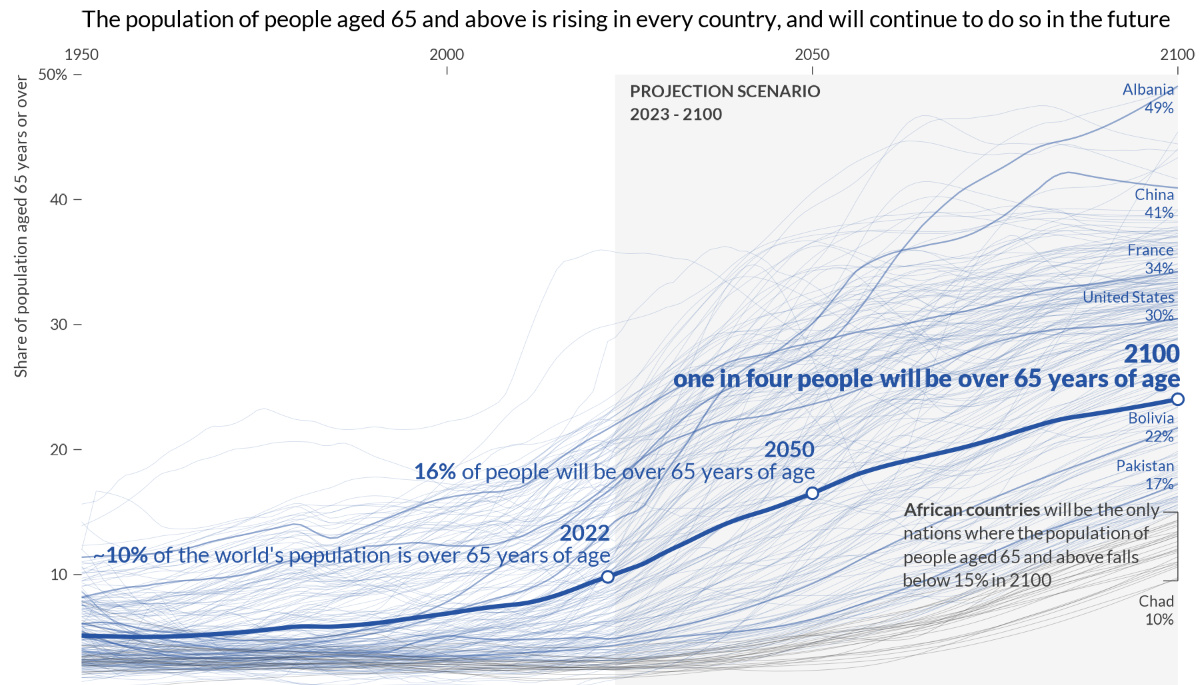
The World’s Aging Population from 1950 to 2100
In 2022, there were 771 million people aged 65+ years globally, accounting for almost 10% of the world’s population.
This segment has been growing at an increasing rate, and it’s expected to hit 16% in 2050, and eventually 24% by 2100. Here’s what that’s projected to look like, for every country and territory.
| Country by Population Aged +65 Years | 1950 | 2022 | 2100 |
|---|---|---|---|
| 🇦🇫 Afghanistan | 2.85% | 2.39% | 16.03% |
| 🇦🇱 Albania | 6.04% | 16.66% | 49.08% |
| 🇩🇿 Algeria | 3.49% | 6.39% | 28.83% |
| 🇦🇸 American Samoa | 2.38% | 7.27% | 45.41% |
| 🇦🇩 Andorra | 10.02% | 14.98% | 37.04% |
| 🇦🇴 Angola | 2.93% | 2.6% | 12.07% |
| 🇦🇮 Anguilla | 3.69% | 10.71% | 37.49% |
| 🇦🇬 Antigua and Barbuda | 4.14% | 10.63% | 35.4% |
| 🇦🇷 Argentina | 4.13% | 11.92% | 31.79% |
| 🇦🇲 Armenia | 8.17% | 13.15% | 36.13% |
| 🇦🇼 Aruba | 1.77% | 16.15% | 36.51% |
| 🇦🇺 Australia | 8.17% | 16.9% | 31.38% |
| 🇦🇹 Austria | 10.42% | 19.81% | 33.93% |
| 🇦🇿 Azerbaijan | 6.89% | 7.11% | 30.5% |
| 🇧🇸 Bahamas | 4.76% | 8.89% | 29.58% |
| 🇧🇭 Bahrain | 2.88% | 3.76% | 21.89% |
| 🇧🇩 Bangladesh | 3.9% | 6.04% | 32.56% |
| 🇧🇧 Barbados | 5.24% | 16.28% | 33.19% |
| 🇧🇾 Belarus | 8.24% | 17.18% | 30.45% |
| 🇧🇪 Belgium | 11.03% | 19.73% | 32.83% |
| 🇧🇿 Belize | 3.57% | 5.09% | 29.21% |
| 🇧🇯 Benin | 7.85% | 3.06% | 11.03% |
| 🇧🇲 Bermuda | 5.71% | 20.41% | 37.73% |
| 🇧🇹 Bhutan | 2.53% | 6.25% | 33.35% |
| 🇧🇴 Bolivia | 6.11% | 4.85% | 21.75% |
| 🇧🇶 Bonaire Sint Eustatius and Saba | 14.22% | 13.84% | 28.94% |
| 🇧🇦 Bosnia and Herzegovina | 3.95% | 18.4% | 36.4% |
| 🇧🇼 Botswana | 4.32% | 3.65% | 17.96% |
| 🇧🇷 Brazil | 2.39% | 9.88% | 33.52% |
| 🇻🇬 British Virgin Islands | 8.63% | 9.95% | 32.47% |
| 🇧🇳 Brunei | 4.85% | 6.17% | 30.93% |
| 🇧🇬 Bulgaria | 6.66% | 22.38% | 37.13% |
| 🇧🇫 Burkina Faso | 2.01% | 2.53% | 13.07% |
| 🇧🇮 Burundi | 3.22% | 2.48% | 13.23% |
| 🇰🇭 Cambodia | 2.67% | 5.81% | 26.43% |
| 🇨🇲 Cameroon | 3.47% | 2.67% | 11.89% |
| 🇨🇦 Canada | 7.7% | 19.03% | 31.55% |
| 🇨🇻 Cape Verde | 3.67% | 5.55% | 32.63% |
| 🇰🇾 Cayman Islands | 6.05% | 8.17% | 28.75% |
| 🇨🇫 Central African Republic | 5.% | 2.51% | 11.43% |
| 🇹🇩 Chad | 4.33% | 2.01% | 9.64% |
| 🇨🇱 Chile | 3.3% | 13.03% | 36.61% |
| 🇨🇳 China | 5.04% | 13.72% | 40.93% |
| 🇨🇴 Colombia | 3.22% | 9.% | 34.49% |
| 🇰🇲 Comoros | 3.8% | 4.28% | 17.81% |
| 🇨🇬 Congo | 3.36% | 2.72% | 11.99% |
| 🇨🇰 Cook Islands | 2.94% | 11.73% | 29.75% |
| 🇨🇷 Costa Rica | 2.97% | 10.83% | 36.99% |
| 🇨🇮 Cote d'Ivoire | 2.21% | 2.4% | 10.86% |
| 🇭🇷 Croatia | 7.82% | 22.36% | 37.03% |
| 🇨🇺 Cuba | 4.36% | 15.81% | 36.31% |
| 🇨🇼 Curacao | 5.82% | 14.95% | 30.46% |
| 🇨🇾 Cyprus | 5.95% | 14.83% | 33.36% |
| 🇨🇿 Czechia | 8.29% | 20.64% | 26.94% |
| 🇨🇩 Democratic Republic of Congo | 3.77% | 2.92% | 10.62% |
| 🇩🇰 Denmark | 9.04% | 20.49% | 30.45% |
| 🇩🇯 Djibouti | 1.99% | 4.54% | 19.68% |
| 🇩🇲 Dominica | 7.67% | 9.53% | 34.28% |
| 🇩🇴 Dominican Republic | 2.72% | 7.4% | 30.47% |
| 🇪🇨 Ecuador | 5.2% | 7.83% | 31.97% |
| 🇪🇬 Egypt | 2.95% | 4.83% | 21.77% |
| 🇸🇻 El Salvador | 3.93% | 8.22% | 36.02% |
| 🇬🇶 Equatorial Guinea | 5.53% | 3.12% | 15.13% |
| 🇪🇷 Eritrea | 3.2% | 4.01% | 19.86% |
| 🇪🇪 Estonia | 10.56% | 20.58% | 34.15% |
| 🇸🇿 Eswatini | 2.68% | 4.% | 16.26% |
| 🇪🇹 Ethiopia | 3.01% | 3.14% | 18.6% |
| 🇫🇴 Faeroe Islands | 7.59% | 17.92% | 26.91% |
| 🇫🇰 Falkland Islands | 8.27% | 11.08% | 35.86% |
| 🇫🇯 Fiji | 5.99% | 5.9% | 20.6% |
| 🇫🇮 Finland | 6.63% | 23.27% | 34.04% |
| 🇫🇷 France | 11.39% | 21.66% | 34.23% |
| 🇬🇫 French Guiana | 7.96% | 5.98% | 21.13% |
| 🇵🇫 French Polynesia | 3.% | 10.07% | 37.85% |
| 🇬🇦 Gabon | 7.21% | 3.89% | 16.25% |
| 🇬🇲 Gambia | 2.5% | 2.43% | 16.06% |
| 🇬🇪 Georgia | 9.35% | 14.61% | 31.19% |
| 🇩🇪 Germany | 9.46% | 22.41% | 33.72% |
| 🇬🇭 Ghana | 4.62% | 3.55% | 15.91% |
| 🇬🇮 Gibraltar | 6.94% | 20.84% | 37.63% |
| 🇬🇷 Greece | 6.8% | 22.82% | 37.52% |
| 🇬🇱 Greenland | 3.06% | 10.02% | 29.16% |
| 🇬🇩 Grenada | 5.12% | 10.07% | 30.54% |
| 🇬🇵 Guadeloupe | 5.51% | 20.04% | 34.45% |
| 🇬🇺 Guam | 1.11% | 11.84% | 31.19% |
| 🇬🇹 Guatemala | 2.31% | 4.91% | 28.05% |
| 🇬🇬 Guernsey | 11.96% | 16.64% | 35.4% |
| 🇬🇳 Guinea | 5.39% | 3.32% | 14.% |
| 🇬🇼 Guinea-Bissau | 3.45% | 2.82% | 14.34% |
| 🇬🇾 Guyana | 3.89% | 6.28% | 28.94% |
| 🇭🇹 Haiti | 3.64% | 4.54% | 19.07% |
| 🇭🇳 Honduras | 3.96% | 4.27% | 26.5% |
| 🇭🇰 Hong Kong | 2.48% | 20.47% | 41.64% |
| 🇭🇺 Hungary | 7.81% | 20.01% | 31.85% |
| 🇮🇸 Iceland | 7.52% | 15.33% | 34.25% |
| 🇮🇳 India | 3.1% | 6.9% | 29.81% |
| 🇮🇩 Indonesia | 1.74% | 6.86% | 25.28% |
| 🇮🇷 Iran | 5.22% | 7.62% | 33.72% |
| 🇮🇶 Iraq | 2.79% | 3.41% | 18.44% |
| 🇮🇪 Ireland | 10.99% | 15.14% | 32.48% |
| 🇮🇲 Isle of Man | 13.9% | 22.29% | 31.8% |
| 🇮🇱 Israel | 4.% | 12.04% | 25.97% |
| 🇮🇹 Italy | 8.09% | 24.05% | 38.19% |
| 🇯🇲 Jamaica | 3.83% | 7.45% | 44.05% |
| 🇯🇵 Japan | 4.89% | 29.92% | 38.7% |
| 🇯🇪 Jersey | 12.34% | 16.22% | 30.52% |
| 🇯🇴 Jordan | 5.03% | 3.84% | 27.3% |
| 🇰🇿 Kazakhstan | 6.47% | 8.04% | 19.58% |
| 🇰🇪 Kenya | 5.28% | 2.87% | 16.98% |
| 🇰🇮 Kiribati | 7.13% | 3.81% | 17.33% |
| 🇽🇰 Kosovo | 5.33% | 10.19% | 43.35% |
| 🇰🇼 Kuwait | 2.88% | 4.93% | 31.56% |
| 🇰🇬 Kyrgyzstan | 7.91% | 4.54% | 21.08% |
| 🇱🇦 Laos | 2.13% | 4.45% | 25.24% |
| 🇱🇻 Latvia | 10.12% | 21.86% | 32.86% |
| 🇱🇧 Lebanon | 7.24% | 9.89% | 32.11% |
| 🇱🇸 Lesotho | 6.34% | 4.2% | 13.44% |
| 🇱🇷 Liberia | 2.97% | 3.31% | 13.88% |
| 🇱🇾 Libya | 5.21% | 4.86% | 27.77% |
| 🇱🇮 Liechtenstein | 7.89% | 19.37% | 34.79% |
| 🇱🇹 Lithuania | 8.65% | 20.8% | 32.79% |
| 🇱🇺 Luxembourg | 9.71% | 15.03% | 31.55% |
| 🇲🇴 Macao | 3.11% | 13.% | 32.39% |
| 🇲🇬 Madagascar | 3.25% | 3.35% | 16.21% |
| 🇲🇼 Malawi | 3.06% | 2.61% | 15.61% |
| 🇲🇾 Malaysia | 4.91% | 7.5% | 30.78% |
| 🇲🇻 Maldives | 3.14% | 4.78% | 35.61% |
| 🇲🇱 Mali | 2.78% | 2.38% | 11.% |
| 🇲🇹 Malta | 7.42% | 19.13% | 38.26% |
| 🇲🇭 Marshall Islands | 5.68% | 4.56% | 17.8% |
| 🇲🇶 Martinique | 5.85% | 22.77% | 37.31% |
| 🇲🇷 Mauritania | 1.44% | 3.22% | 15.03% |
| 🇲🇺 Mauritius | 3.18% | 12.79% | 33.76% |
| 🇾🇹 Mayotte | 6.61% | 2.88% | 18.15% |
| 🇲🇽 Mexico | 2.99% | 8.32% | 34.88% |
| 🇫🇲 Micronesia (country) | 4.11% | 6.16% | 27.59% |
| 🇲🇩 Moldova | 7.56% | 12.98% | 26.36% |
| 🇲🇨 Monaco | 15.64% | 35.92% | 30.16% |
| 🇲🇳 Mongolia | 3.87% | 4.61% | 26.18% |
| 🇲🇪 Montenegro | 7.85% | 16.55% | 34.16% |
| 🇲🇸 Montserrat | 7.92% | 17.7% | 33.05% |
| 🇲🇦 Morocco | 2.86% | 7.72% | 29.97% |
| 🇲🇿 Mozambique | 3.13% | 2.57% | 13.43% |
| 🇲🇲 Myanmar | 3.21% | 6.82% | 23.69% |
| 🇳🇦 Namibia | 4.1% | 3.97% | 15.38% |
| 🇳🇷 Nauru | 8.98% | 2.5% | 15.87% |
| 🇳🇵 Nepal | 2.74% | 6.09% | 29.51% |
| 🇳🇱 Netherlands | 7.76% | 20.31% | 32.89% |
| 🇳🇨 New Caledonia | 5.% | 11.02% | 31.61% |
| 🇳🇿 New Zealand | 9.09% | 16.31% | 33.2% |
| 🇳🇮 Nicaragua | 2.71% | 5.29% | 28.92% |
| 🇳🇪 Niger | .92% | 2.4% | 9.76% |
| 🇳🇬 Nigeria | 3.% | 2.97% | 12.31% |
| 🇳🇺 Niue | 4.79% | 15.16% | 22.55% |
| 🇰🇵 North Korea | 2.72% | 11.71% | 30.49% |
| 🇲🇰 North Macedonia | 5.87% | 14.91% | 36.56% |
| 🇲🇵 Northern Mariana Islands | 2.95% | 10.81% | 32.09% |
| 🇳🇴 Norway | 9.52% | 18.44% | 31.65% |
| 🇴🇲 Oman | 3.05% | 2.76% | 23.96% |
| 🇵🇰 Pakistan | 5.48% | 4.27% | 17.23% |
| 🇵🇼 Palau | 8.59% | 9.93% | 21.48% |
| 🇵🇸 Palestine | 4.77% | 3.53% | 23.44% |
| 🇵🇦 Panama | 3.57% | 8.77% | 30.03% |
| 🇵🇬 Papua New Guinea | 1.09% | 3.19% | 16.81% |
| 🇵🇾 Paraguay | 3.73% | 6.26% | 26.51% |
| 🇵🇪 Peru | 3.43% | 8.41% | 30.33% |
| 🇵🇭 Philippines | 3.56% | 5.44% | 23.38% |
| 🇵🇱 Poland | 5.22% | 18.55% | 35.69% |
| 🇵🇹 Portugal | 7.% | 22.9% | 36.28% |
| 🇵🇷 Puerto Rico | 3.63% | 22.93% | 48.9% |
| 🇶🇦 Qatar | 3.5% | 1.52% | 15.01% |
| 🇷🇪 Reunion | 3.81% | 13.28% | 32.4% |
| 🇷🇴 Romania | 7.16% | 18.64% | 32.22% |
| 🇷🇺 Russia | 4.8% | 15.8% | 27.86% |
| 🇷🇼 Rwanda | 2.76% | 3.2% | 17.36% |
| 🇧🇱 Saint Barthlemy | 7.3% | 10.61% | 43.89% |
| 🇸🇭 Saint Helena | 8.63% | 28.66% | 32.61% |
| 🇰🇳 Saint Kitts and Nevis | 5.36% | 10.13% | 29.79% |
| 🇱🇨 Saint Lucia | 3.59% | 9.23% | 33.39% |
| 🇲🇫 Saint Martin (French part) | 4.47% | 11.14% | 30.08% |
| 🇵🇲 Saint Pierre and Miquelon | 6.34% | 17.32% | 33.4% |
| 🇻🇨 Saint Vincent and the Grenadines | 7.71% | 10.86% | 32.34% |
| 🇼🇸 Samoa | 2.52% | 5.22% | 18.75% |
| 🇸🇲 San Marino | 10.15% | 20.47% | 35.73% |
| 🇸🇹 Sao Tome and Principe | 3.92% | 3.76% | 15.6% |
| 🇸🇦 Saudi Arabia | 3.32% | 2.81% | 30.28% |
| 🇸🇳 Senegal | 3.42% | 3.14% | 16.54% |
| 🇷🇸 Serbia | 6.15% | 20.56% | 37.55% |
| 🇸🇨 Seychelles | 10.68% | 8.16% | 28.84% |
| 🇸🇱 Sierra Leone | 3.02% | 3.14% | 15.52% |
| 🇸🇬 Singapore | 2.29% | 15.12% | 36.51% |
| 🇸🇽 Sint Maarten (Dutch part) | 12.03% | 10.57% | 34.51% |
| 🇸🇰 Slovakia | 6.63% | 16.98% | 33.4% |
| 🇸🇮 Slovenia | 7.52% | 20.96% | 33.59% |
| 🇸🇧 Solomon Islands | 4.03% | 3.47% | 15.29% |
| 🇸🇴 Somalia | 2.6% | 2.57% | 10.75% |
| 🇿🇦 South Africa | 4.06% | 5.89% | 20.55% |
| 🇰🇷 South Korea | 2.74% | 17.49% | 44.44% |
| 🇸🇸 South Sudan | 3.48% | 2.89% | 13.11% |
| 🇪🇸 Spain | 7.23% | 20.27% | 38.72% |
| 🇱🇰 Sri Lanka | 8.76% | 11.54% | 35.73% |
| 🇸🇩 Sudan | 3.03% | 3.5% | 13.28% |
| 🇸🇷 Suriname | 4.09% | 7.39% | 25.8% |
| 🇸🇪 Sweden | 10.19% | 20.25% | 31.83% |
| 🇨🇭 Switzerland | 9.49% | 19.31% | 32.61% |
| 🇸🇾 Syria | 7.66% | 4.68% | 24.62% |
| 🇹🇼 Taiwan | 2.11% | 16.71% | 37.32% |
| 🇹🇯 Tajikistan | 4.34% | 3.47% | 19.43% |
| 🇹🇿 Tanzania | 2.2% | 3.1% | 14.97% |
| 🇹🇭 Thailand | 3.21% | 15.21% | 39.17% |
| 🇹🇱 Timor | 3.14% | 5.21% | 25.42% |
| 🇹🇬 Togo | 4.29% | 3.13% | 11.77% |
| 🇹🇰 Tokelau | 4.7% | 8.66% | 25.03% |
| 🇹🇴 Tonga | 4.6% | 6.22% | 21.65% |
| 🇹🇹 Trinidad and Tobago | 3.93% | 11.52% | 32.67% |
| 🇹🇳 Tunisia | 4.4% | 9.02% | 31.24% |
| 🇹🇷 Turkey | 3.77% | 8.64% | 33.9% |
| 🇹🇲 Turkmenistan | 5.84% | 5.15% | 21.55% |
| 🇹🇨 Turks and Caicos Islands | 5.79% | 10.34% | 28.25% |
| 🇹🇻 Tuvalu | 4.98% | 6.48% | 16.15% |
| 🇺🇬 Uganda | 2.87% | 1.69% | 14.33% |
| 🇺🇦 Ukraine | 7.54% | 18.81% | 33.2% |
| 🇦🇪 United Arab Emirates | 3.35% | 1.83% | 15.77% |
| 🇬🇧 United Kingdom | 10.84% | 19.17% | 32.56% |
| 🇺🇸 United States | 8.18% | 17.13% | 30.47% |
| 🇻🇮 United States Virgin Islands | 7.54% | 20.42% | 39.11% |
| 🇺🇾 Uruguay | 8.23% | 15.58% | 35.98% |
| 🇺🇿 Uzbekistan | 5.87% | 5.14% | 22.24% |
| 🇻🇺 Vanuatu | 5.65% | 3.74% | 16.29% |
| 🇻🇪 Venezuela | 2.29% | 8.61% | 27.71% |
| 🇻🇳 Vietnam | 4.13% | 9.12% | 30.02% |
| 🇼🇫 Wallis and Futuna | 1.76% | 13.47% | 32.98% |
| 🇪🇭 Western Sahara | 2.82% | 5.84% | 23.73% |
| 🇾🇪 Yemen | 3.98% | 2.66% | 18.25% |
| 🇿🇲 Zambia | 2.76% | 1.75% | 12.66% |
| 🇿🇼 Zimbabwe | 3.18% | 3.32% | 14.22% |
| 🌐 World | 5.13% | 9.82% | 24.03% |
Some of the places with high elderly shares today include high-income countries like Japan (30%), Italy (24%), and Finland (23%).
The lowest shares are concentrated in the Middle East and Africa. Many countries have just 2% of their population aged 65 years and older, such as Qatar, Uganda, and Afghanistan.
But over time, almost all countries are expected to see their older population segments grow. In just three decades, it is estimated that one-in-four European, North American, and Asian residents will be over 65 years of age.
By 2100, a variety of Asian countries and island nations facing low population growth are expected to see more than one-third of their populations aged 65 years or older, including South Korea and Jamaica at 44%. However, it’s actually Albania that’s the biggest outlier overall, with a projected 49% of its population to be aged 65 and older by 2100.
Passing the Generational Torch
The challenge of an aging population is set to impact all sectors of society, including labor and financial markets, demand for housing and transportation, and especially family structures and intergenerational ties.
One way to help grasp the nature of transition is to note the changing ratio between seniors and young children in the world population, as seen in the below crossover diagram:
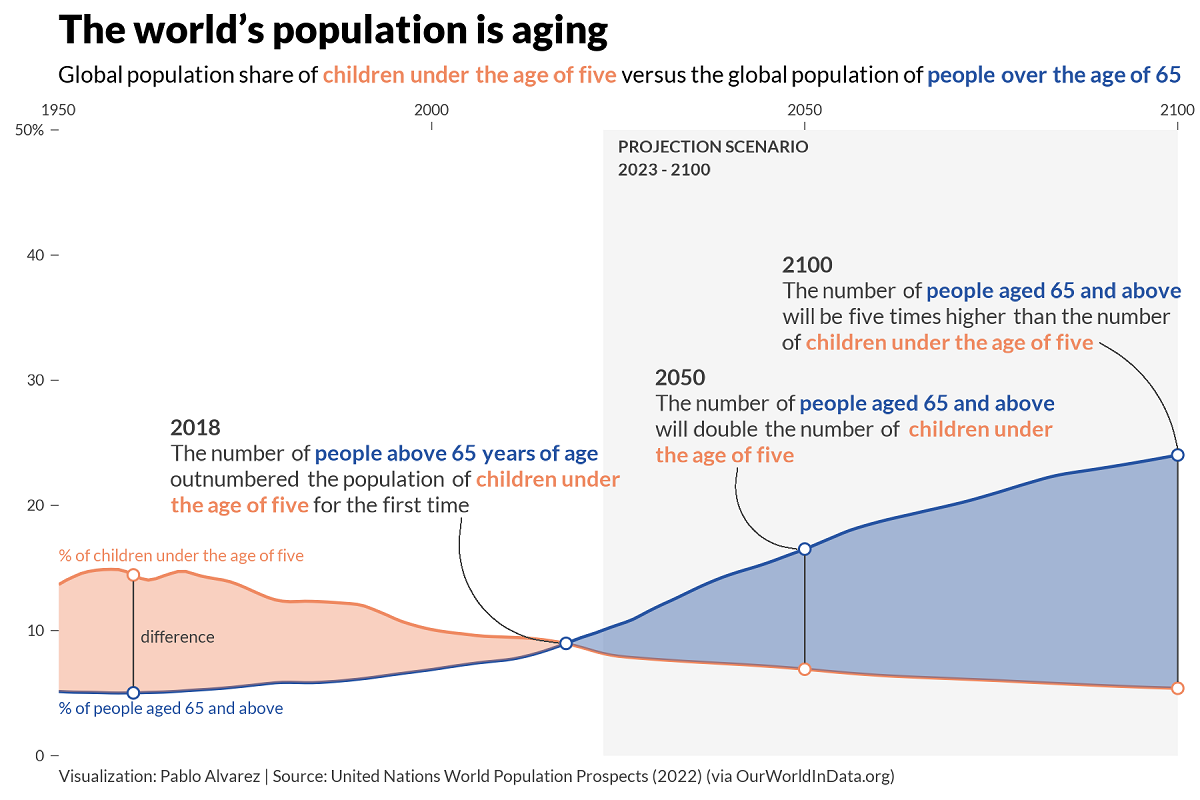
Dropping fertility rates, in addition to improved child and infant mortality rates, are known to have played a major role in the plateauing population of children.
However, not all countries have witnessed this crossover yet, as it usually coincides with higher levels of economic development.
As countries such as India, Brazil, and South Africa reach higher levels of per capita income, they will be likely to follow down the paths of more advanced economies, eventually experiencing similar demographic fates and challenges.

This article was published as a part of Visual Capitalist's Creator Program, which features data-driven visuals from some of our favorite Creators around the world.


Healthcare
Life Expectancy by Region (1950-2050F)
This map shows life expectancy at birth for key global regions, from 1950 to 2050F.
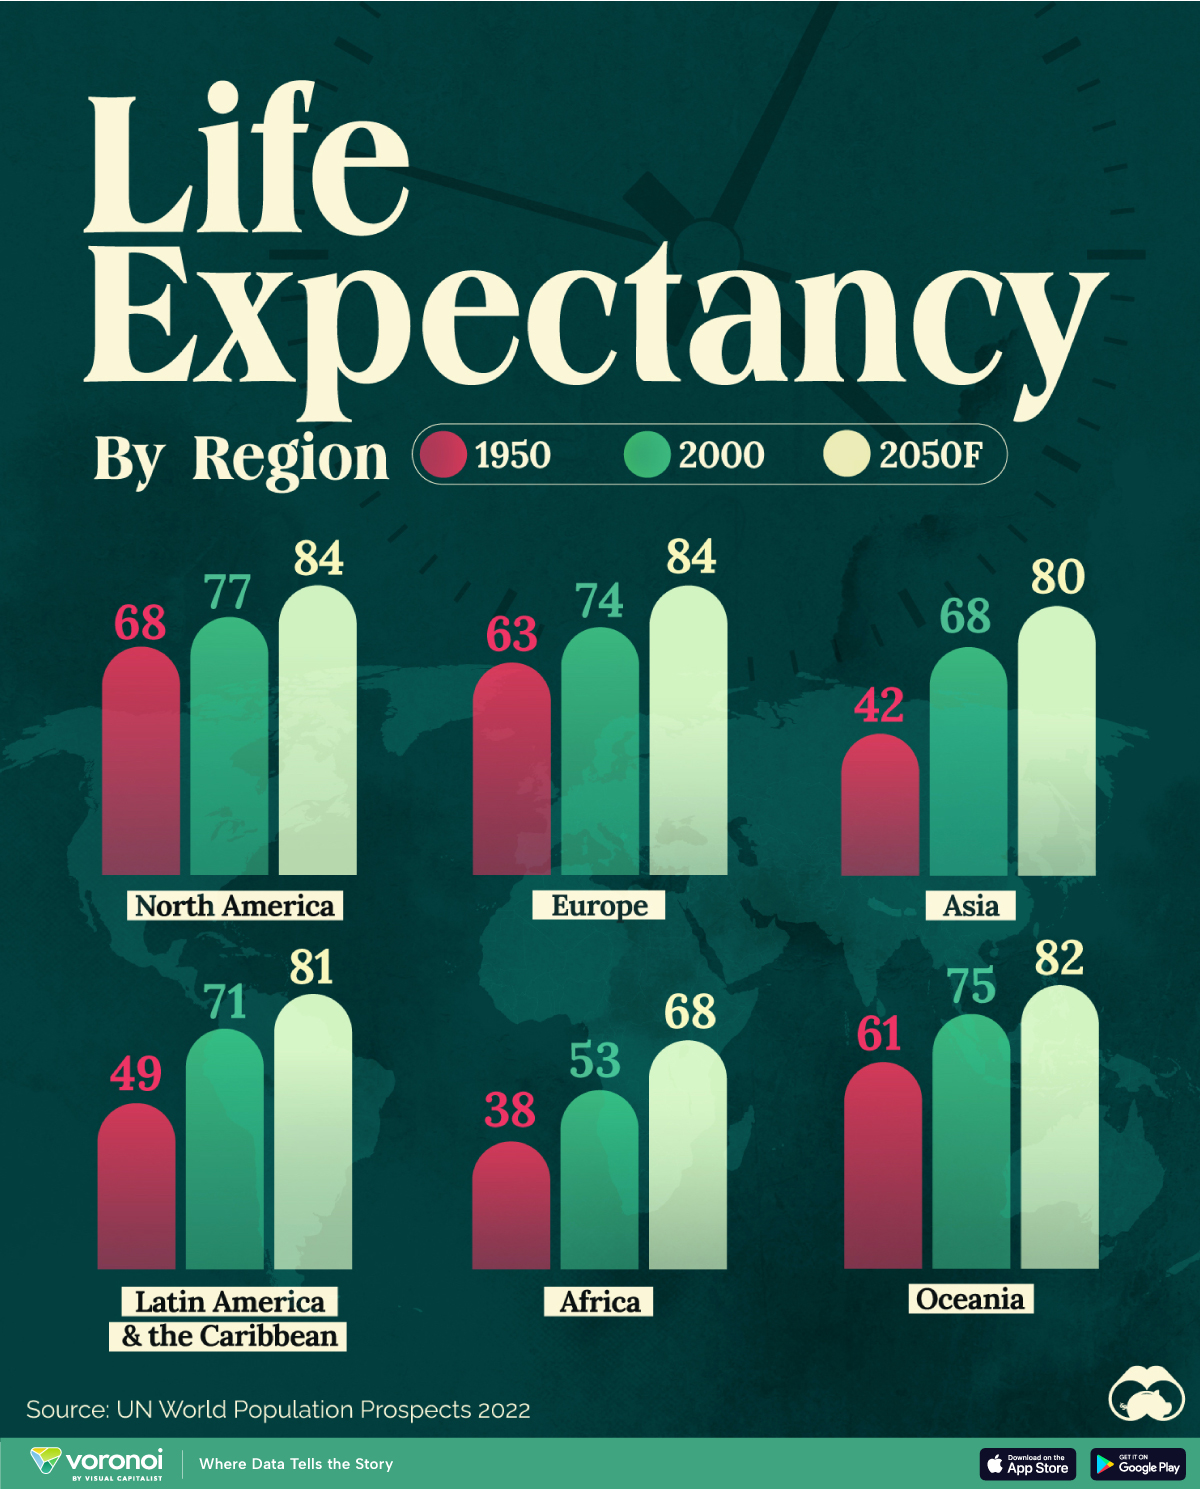
Mapped: Life Expectancy by Region (1950-2050F)
This was originally posted on our Voronoi app. Download the app for free on iOS or Android and discover incredible data-driven charts from a variety of trusted sources.
Average life expectancy at birth is projected to surpass 80 years in most global regions by 2050, according to the UN World Population Prospects 2022.
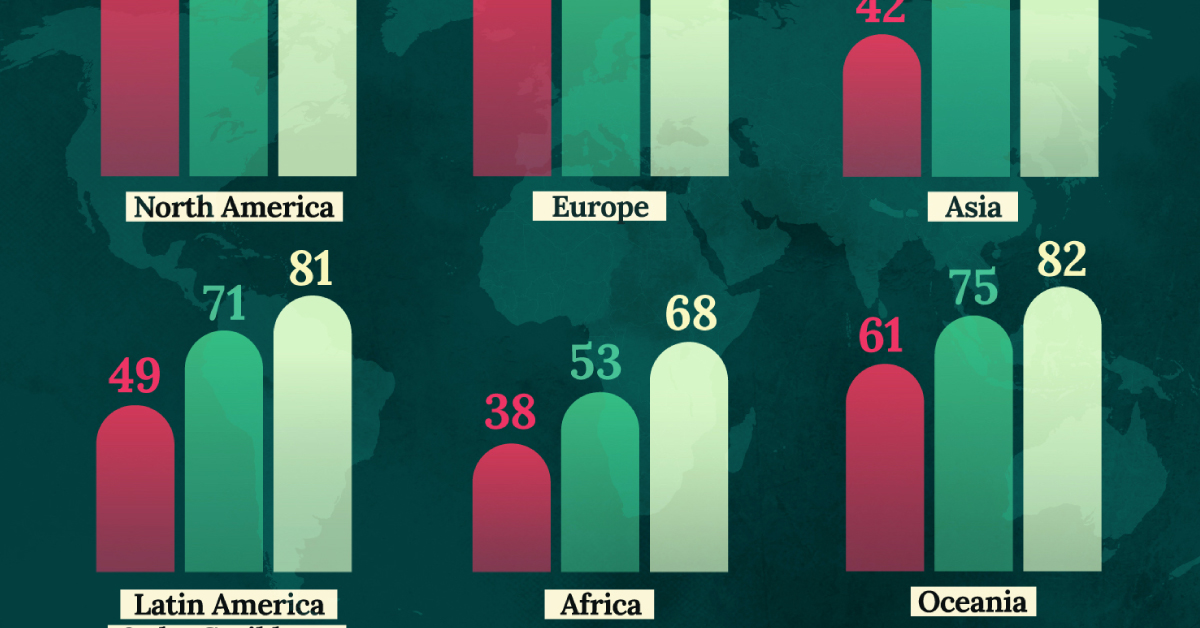
This infographic illustrates the trajectory of life expectancy at birth for both sexes, comparing data from 1950 and 2000 with the organization’s projections for the year 2050.
Life Expectancy to See Substantial Growth
At the beginning of the 19th century, no country had a life expectancy exceeding 40 years, with much of the global population enduring extreme poverty, limited access to medical care, and a lack of sanitation.
By 1950, newborns in Europe, North America, Oceania, Japan, and parts of South America were seeing life expectancies surpassing 60 years, while in other regions, newborns could only anticipate a lifespan of around 30 years.
For instance, individuals in Norway had a life expectancy of 72 years, while in Mali, it was merely 26 years. On average, Africa had a life expectancy of only 38 years.
Since then, life expectancies have substantially grown worldwide. Notably, between 1950 and 2000, significant progress was observed in Asia and Latin America and the Caribbean.
| Region | 1950 | 2000 | 2050F |
|---|---|---|---|
| North America | 68 | 77 | 84 |
| Latin America & the Caribbean | 49 | 71 | 81 |
| Europe | 63 | 74 | 84 |
| Asia | 42 | 68 | 80 |
| Africa | 38 | 53 | 68 |
| Australia & Oceania | 61 | 75 | 82 |
The improvement in life expectancy can be attributed to various factors such as advancements in medical technology, better healthcare infrastructure, improved sanitation, access to clean water, and increased awareness about health and nutrition.
In Perspective With History
Although today it seems like rising life expectancy is a given, for much of history it’s worth noting that the situation was much more static.
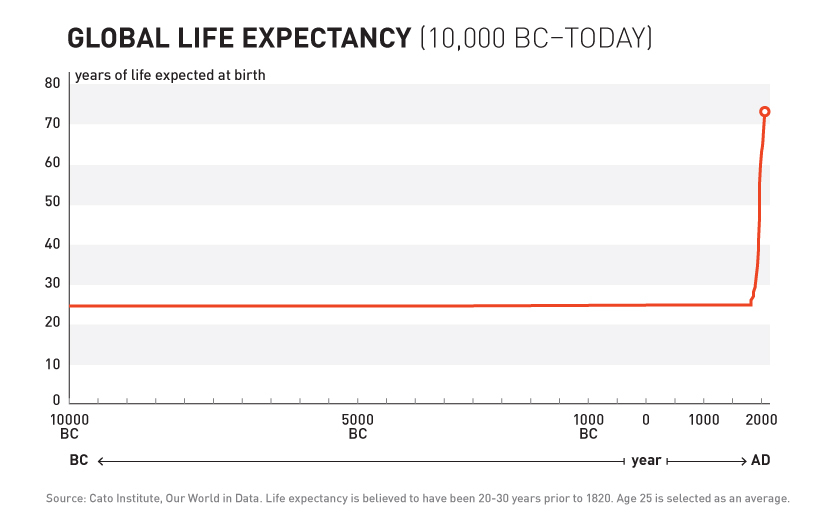
As shown in the above chart, for most of human history life expectancy at birth actually sat in the 20-30 year range. It’s only since the mid-19th century that the aforementioned improvements (sanitation, clean water, etc.) allowed for the exponential and regular progress we see today.

-

 Energy6 days ago
Mapped: The Age of Energy Projects in Interconnection Queues, by State
-

 AI2 weeks ago
Visualizing AI Patents by Country
-

 Markets2 weeks ago
Economic Growth Forecasts for G7 and BRICS Countries in 2024
-

 Wealth2 weeks ago
Charted: Which City Has the Most Billionaires in 2024?
-

 Technology2 weeks ago
All of the Grants Given by the U.S. CHIPS Act
-

 Green1 week ago
The Carbon Footprint of Major Travel Methods
-

 United States1 week ago
Visualizing the Most Common Pets in the U.S.
-

 Culture1 week ago
The World’s Top Media Franchises by All-Time Revenue