Article

An Approach to Delineate Potential Groundwater Zones in Kilinochchi District, Sri Lanka, Using GIS Techniques

by
Vyddiyaratnam Pathmanandakumar
1,
Nadarajapillai Thasarathan
2,* and
Manjula Ranagalage
3
1
Department of Geography, Faculty of Arts and Culture, Eastern University Sri Lanka, Chenkalady 30350, Sri Lanka
2
Department of Geography, Faculty of Arts, University of Jaffna, Thirunelvely, Jaffna 40000, Sri Lanka
3
Department of Environmental Management, Faculty of Social Sciences and Humanities, Rajarata University of Sri Lanka, Mihintale 50300, Sri Lanka
*
Author to whom correspondence should be addressed.
ISPRS Int. J. Geo-Inf. 2021, 10(11), 730; https://doi.org/10.3390/ijgi10110730
Submission received: 4 August 2021 / Revised: 13 October 2021 / Accepted: 23 October 2021 / Published: 28 October 2021

Abstract

:
The scarcity of surface water resources in the dry season in the Kilinochchi district increases the demand for freshwater. Therefore, the main objective of this study is to delineate potential groundwater zones in Kilinochchi, Sri Lanka, using integrated remote sensing (RS), geographic information systems (GIS) and the analytical hierarchy process (AHP). Groundwater potential zones are demarcated for the Kilinochchi district by overlaying thematic layers: geology, geomorphology, land use/land cover, soil types, drainage density, slope, lineament, and rainfall. The thematic layers were integrated into a geographic information system, and a weighted overlay analysis was carried out to delineate groundwater zones. Thus the resultant map is categorized into five different potential zones: very low (59.12 km2), low (207.78 km2), moderate (309.89 km2), high (507.74 km2), and very high (111.26 km2). The groundwater potential map was validated with the existing seventy-nine wells, which indicated a good prediction accuracy of 81.8%. This suggests that the results obtained by integrating RS-GIS and AHP are well-matched with the existing well water depth. The AHP approach based on RS-GIS was a handy and efficient technique for assessing potential groundwater zones. This research will help policymakers better manage the Kilinochchi district’s groundwater resources and give scope for further research into groundwater exploration in the area.

1. Introduction

Groundwater or subsurface water is “a term used to denote all the waters found beneath the ground surface” [1]. Groundwater is defined as “water in a saturated zone, filling the pore spaces among mineral grains or cracks and fractured rocks in a rock mass” [2]. Naturally, the water from rain and snow infiltrates through soil or the pore spaces of underlying rocks to replenish the groundwater [1,2]. Therefore, climate, characteristics of surface and subsurface, and their relationship with hydrology decide the occurrence and distribution of groundwater [1]. About one-third of the world’s population utilizes groundwater for drinking purposes [3], and demand for groundwater increases worldwide due to many factors such as population growth, advanced irrigation practice, industrial usages, etc. [4,5,6]. Population growth, increasing irrigated agriculture practices, and economic development have all increased groundwater usage and demand, with little consideration for the importance of the environmental balance of groundwater [7,8]. The total groundwater extraction has many uses worldwide: 36% for households, 42% for agriculture, and 27% for industries [8,9]. Notably, there is tremendous pressure on groundwater in developing countries [10].
Agriculture is vital to the Sri Lankan economy [11]. In Sri Lanka, water availability and demand for it vary spatially and temporally. Groundwater is widely used across Sri Lanka. This is because it is recognized that groundwater provides a generally stable source of water or serves as a trustworthy supplement to surface water [12]. Groundwater is expected to be used for drinking and domestic purposes by 72% of the rural population and 22% of the urban population in Sri Lanka [13]. Six main types of groundwater aquifers have been identified across Sri Lanka: the shallow karstic aquifer of Jaffna Peninsula, deep confined aquifers, coastal sand aquifers, alluvial aquifers, shallow regolith aquifer of the Hard Rock Region, and the southwestern lateritic (Cabook) aquifer [14]. The World Bank estimated in 2014 that Sri Lanka’s annual freshwater withdrawals were 13 billion cubic meters [15]. Water shortage is the foremost issue in the country’s dry zone [16,17,18,19], where there is a significant demand for water to irrigate 85% of the land to boost agricultural productivity [20,21]. Although Sri Lanka has six types of aquifers and a wide range of geological and hydrogeological settings in its 65,610 km2 territory, groundwater extraction for agricultural purposes has long been restricted to the districts in the Northern Province (Jaffna, Kilinochchi, Mullaitivu, Vavuniya, and Mannar), that lack a perennial surface water resource [22,23]. It is estimated that over 55% of Sri Lanka’s population depends on groundwater for everyday domestic consumption [24]. Groundwater has been used for drinking and other domestic purposes across Sri Lanka. However, it is the only source of domestic water in several districts, including Kilinochchi [22]. Overall, Sri Lanka’s groundwater potential is lower than its surface water resources. The total estimated groundwater potential is 7.8 billion m3 per year [22], equivalent to around 15% of the country’s surface water resources [25]. In addition, another 7 km3 of water is shared by surface and groundwater [22].
Groundwater is the primary water source for rural communities in the dry zone of Sri Lanka [13]. The Kilinochchi district falls within the dry zone of Sri Lanka. It consists of two types of aquifers: deep confined aquifers and shallow regolith aquifer of the Hard Rock Region [14] and receives rainfall from the northeast Monsoon and inter-monsoon, which replenishes the groundwater resources [21]. Population in Kilinochchi district has increased from 23,625 in 2009 to 146,199 in 2020 [26]. With decreasing rainfall [27,28] and an increasing population in the dry zone, there is a significant demand for water for irrigation and other livelihood needs, which mandates sustainable groundwater use in the dry zone [21]. The seasonal water resource availability per unit area in the study area is less than 0.1 m. With present irrigation efficiency, more portions of the dry zone of Sri Lanka may experience water scarcity by 2025 [21,29]. Sustainable development of groundwater resources is one of the best options for supporting dry-zone populations to improve their livelihoods by increasing agricultural productivity without depleting groundwater reserves.
Despite numerous methods for exploring groundwater resources, for example, drilling, geological, hydrogeological and geophysical methods [8], the most generally used techniques for investigating groundwater resources are drilled tests and stratigraphic investigation [6,9,30]. These methods require extensive time, money, resources, and expert participation [8,9,30,31,32]. The usage of GIS and RS is, on the other hand, less expensive, more responsive, and more convenient [8,9,33,34]. RS is a potentially helpful tool for gathering Spatio-temporal data from a specific location in a short period [30]. The use of remote sensing data in hydrological investigations can give information on spatial and temporal scales, which is necessary for effective analysis, prediction, and validation of hydrological models [30]. Satellite imagery’s capacity to span vast spatial scales is vital for depicting physiographic and structural characteristics, which are essential requirements for delineating potential groundwater zones [30] and have been used by various researchers [35,36,37,38,39,40,41].
On the other hand, GIS provides a distinct work environment for efficiently processing and storing geo-referenced data obtained from multiple sources [35,42,43,44]. The ability of RS and GIS to gather, manipulate, and cover vast amounts of data in a short amount of time makes it a more effective tool for identifying, analyzing, and preserving groundwater resources. As a result, multiple data sources can be incorporated into a GIS platform to build conceptual models for identifying potential groundwater zones in a given area [31,32,37,44,45].
The application of RS and GIS in groundwater resource exploration has become a milestone in groundwater research that provides substantial support for analyzing, monitoring, and protecting groundwater resources [8,46]. Incorporating RS and GIS into groundwater potentiality mapping allows for data storage, manipulation, and analysis [44,47]. Integrated GIS and RS with AHP prove that it is a handy tool for delineating potential groundwater zones by reducing time and cost [4,17,32,37,41,44,45,48,49,50]. Researchers adopt various techniques for delineation potential groundwater zones: statistical method [51], influence factor (IMF) [36,38,40,52], groundwater modelling, the combination of GIS, RS with AHP [37,41,45,49], and GIS-based machine learning [39,53,54]. Many researchers have adopted these methods since they have been demonstrated to be reliable and effective. In addition, several factors are often considered in the integrated approach to reduce inaccuracy and human error (Table 1). AHP is recommended among these methods when there are several alternatives for a set of pairwise comparisons and a lack of adequate valid data for analysis [30,55]. Recently, remote sensing and GIS coupled with AHP techniques have been adopted as a standard methodology for delineating potential groundwater zones in semi-arid areas [37,41,45,49]. AHP is used in conjunction with RS-GIS techniques to delineate possible groundwater zones in the Kilinochchi district. The thematic layers used to delineate groundwater zones vary among research as the selection of attribute layers is arbitrary. In addition, weight assignment for each thematic layer and its classes has been determined based on expert opinion and site-specific conditions. This study used eight factors, including geology, geomorphology, land use/land cover, soil types, drainage density, slope, lineament, and rainfall, to delineate the potential groundwater zones. In the present study, AHP techniques combined with RS-GIS methods delineate the groundwater potential zones. AHP is considered a simple, transparent, effective, and reliable technique for delineating groundwater potential zones [9]. As groundwater is dynamic, RS data integration into the GIS is convenient for identifying the potential groundwater zones (GWPZ).
Groundwater is the primary source of drinking and agricultural practice in the Kilinochchi district [22]. It is indiscriminately extracted in many parts of the district, as surface water is insufficient to satisfy the demand. Hence, authorities need to identify the presence of groundwater. The study area consists of several wells, which demonstrate the importance of groundwater to the district’s socio-economic growth. Apart from its significance, a limited number of studies (only one study) on groundwater within the study region has been undertaken to date [21], and only five relevant elements were evaluated in that article. In the current study, eight groundwater influencing factors, including geology, geomorphology, land use/land cover, soil types, drainage density, slope, lineament, and rainfall, are integrated into the GIS platform with the help of the AHP technique to identify potential groundwater zones within the study area. Identifying, monitoring, and preserving the potential groundwater zones is essential for informed decision-making about groundwater resource development strategies [59]. Thus, the delineation of potential groundwater zones by an appropriate modelling approach is necessary to address the water scarcity problem of the drought-prone district. Therefore, the study’s main objective is to delineate potential groundwater zones in the Kilinochchi district using RS, GIS, and AHP techniques. ROC and AUC from observed wells’ data were used to validate the robustness of RS-GIS and AHP approaches. Moreover, the efficiency of GWPZ mapping was validated by using existing wells’ water depth in this region.

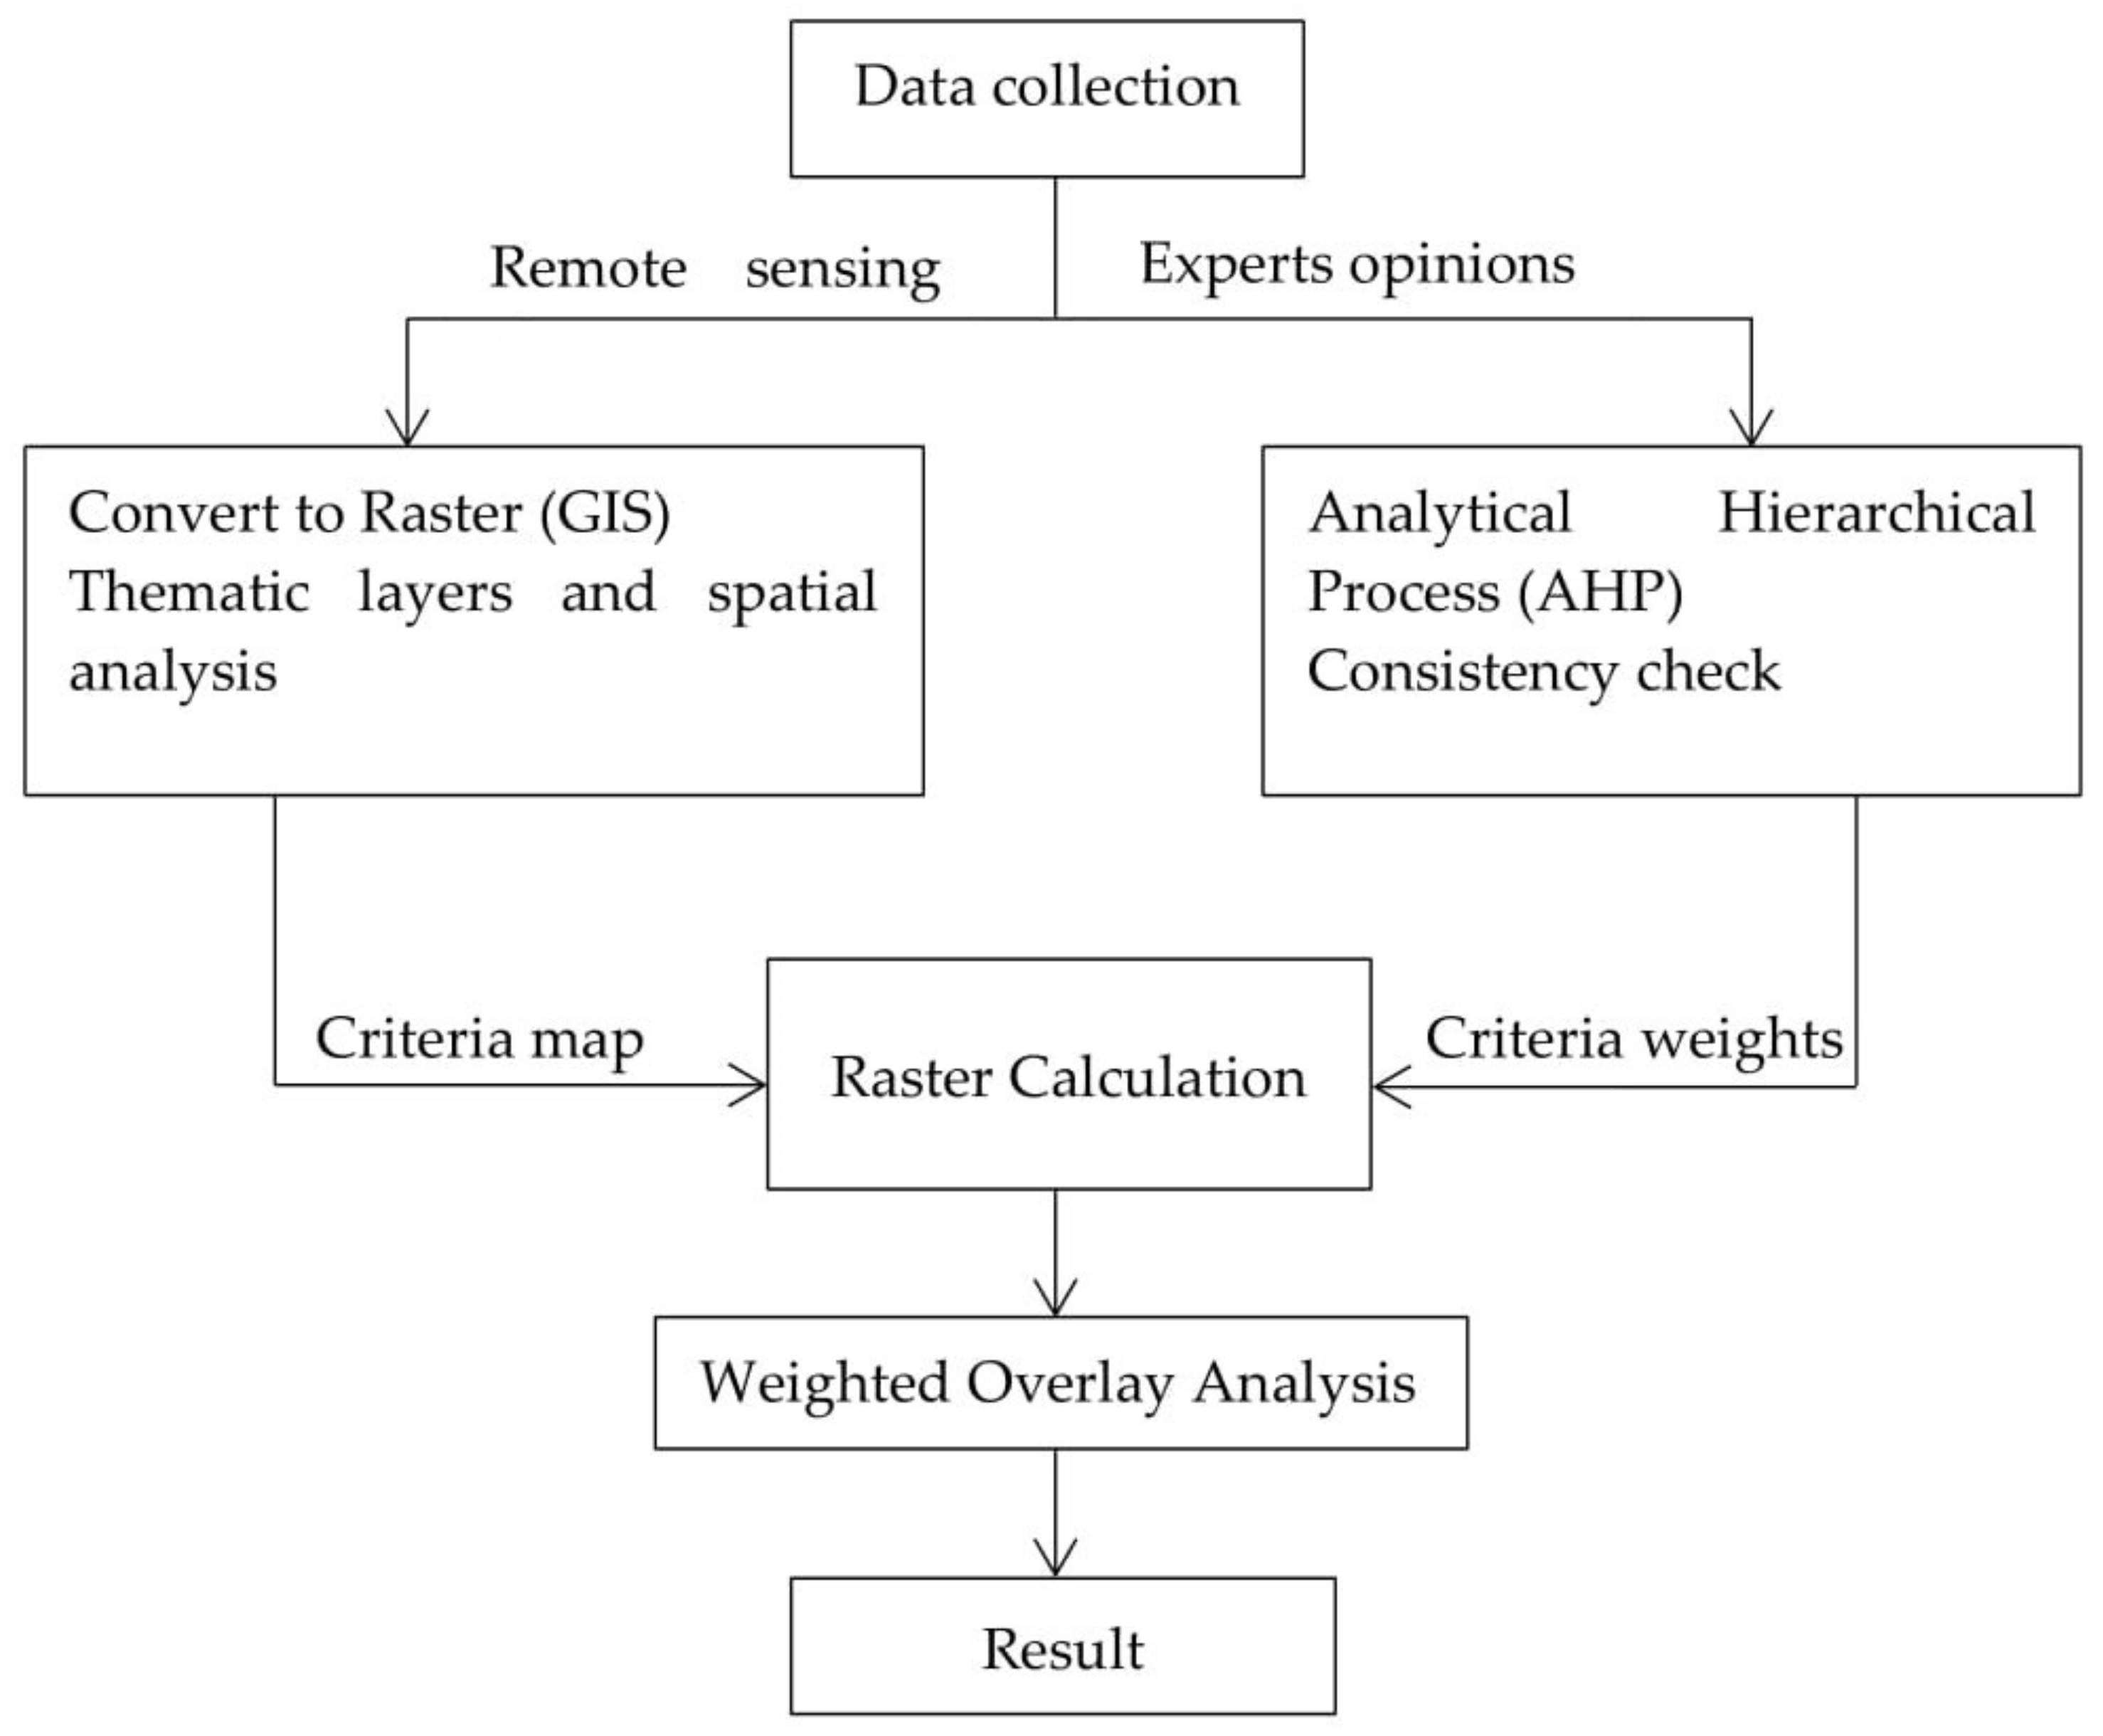
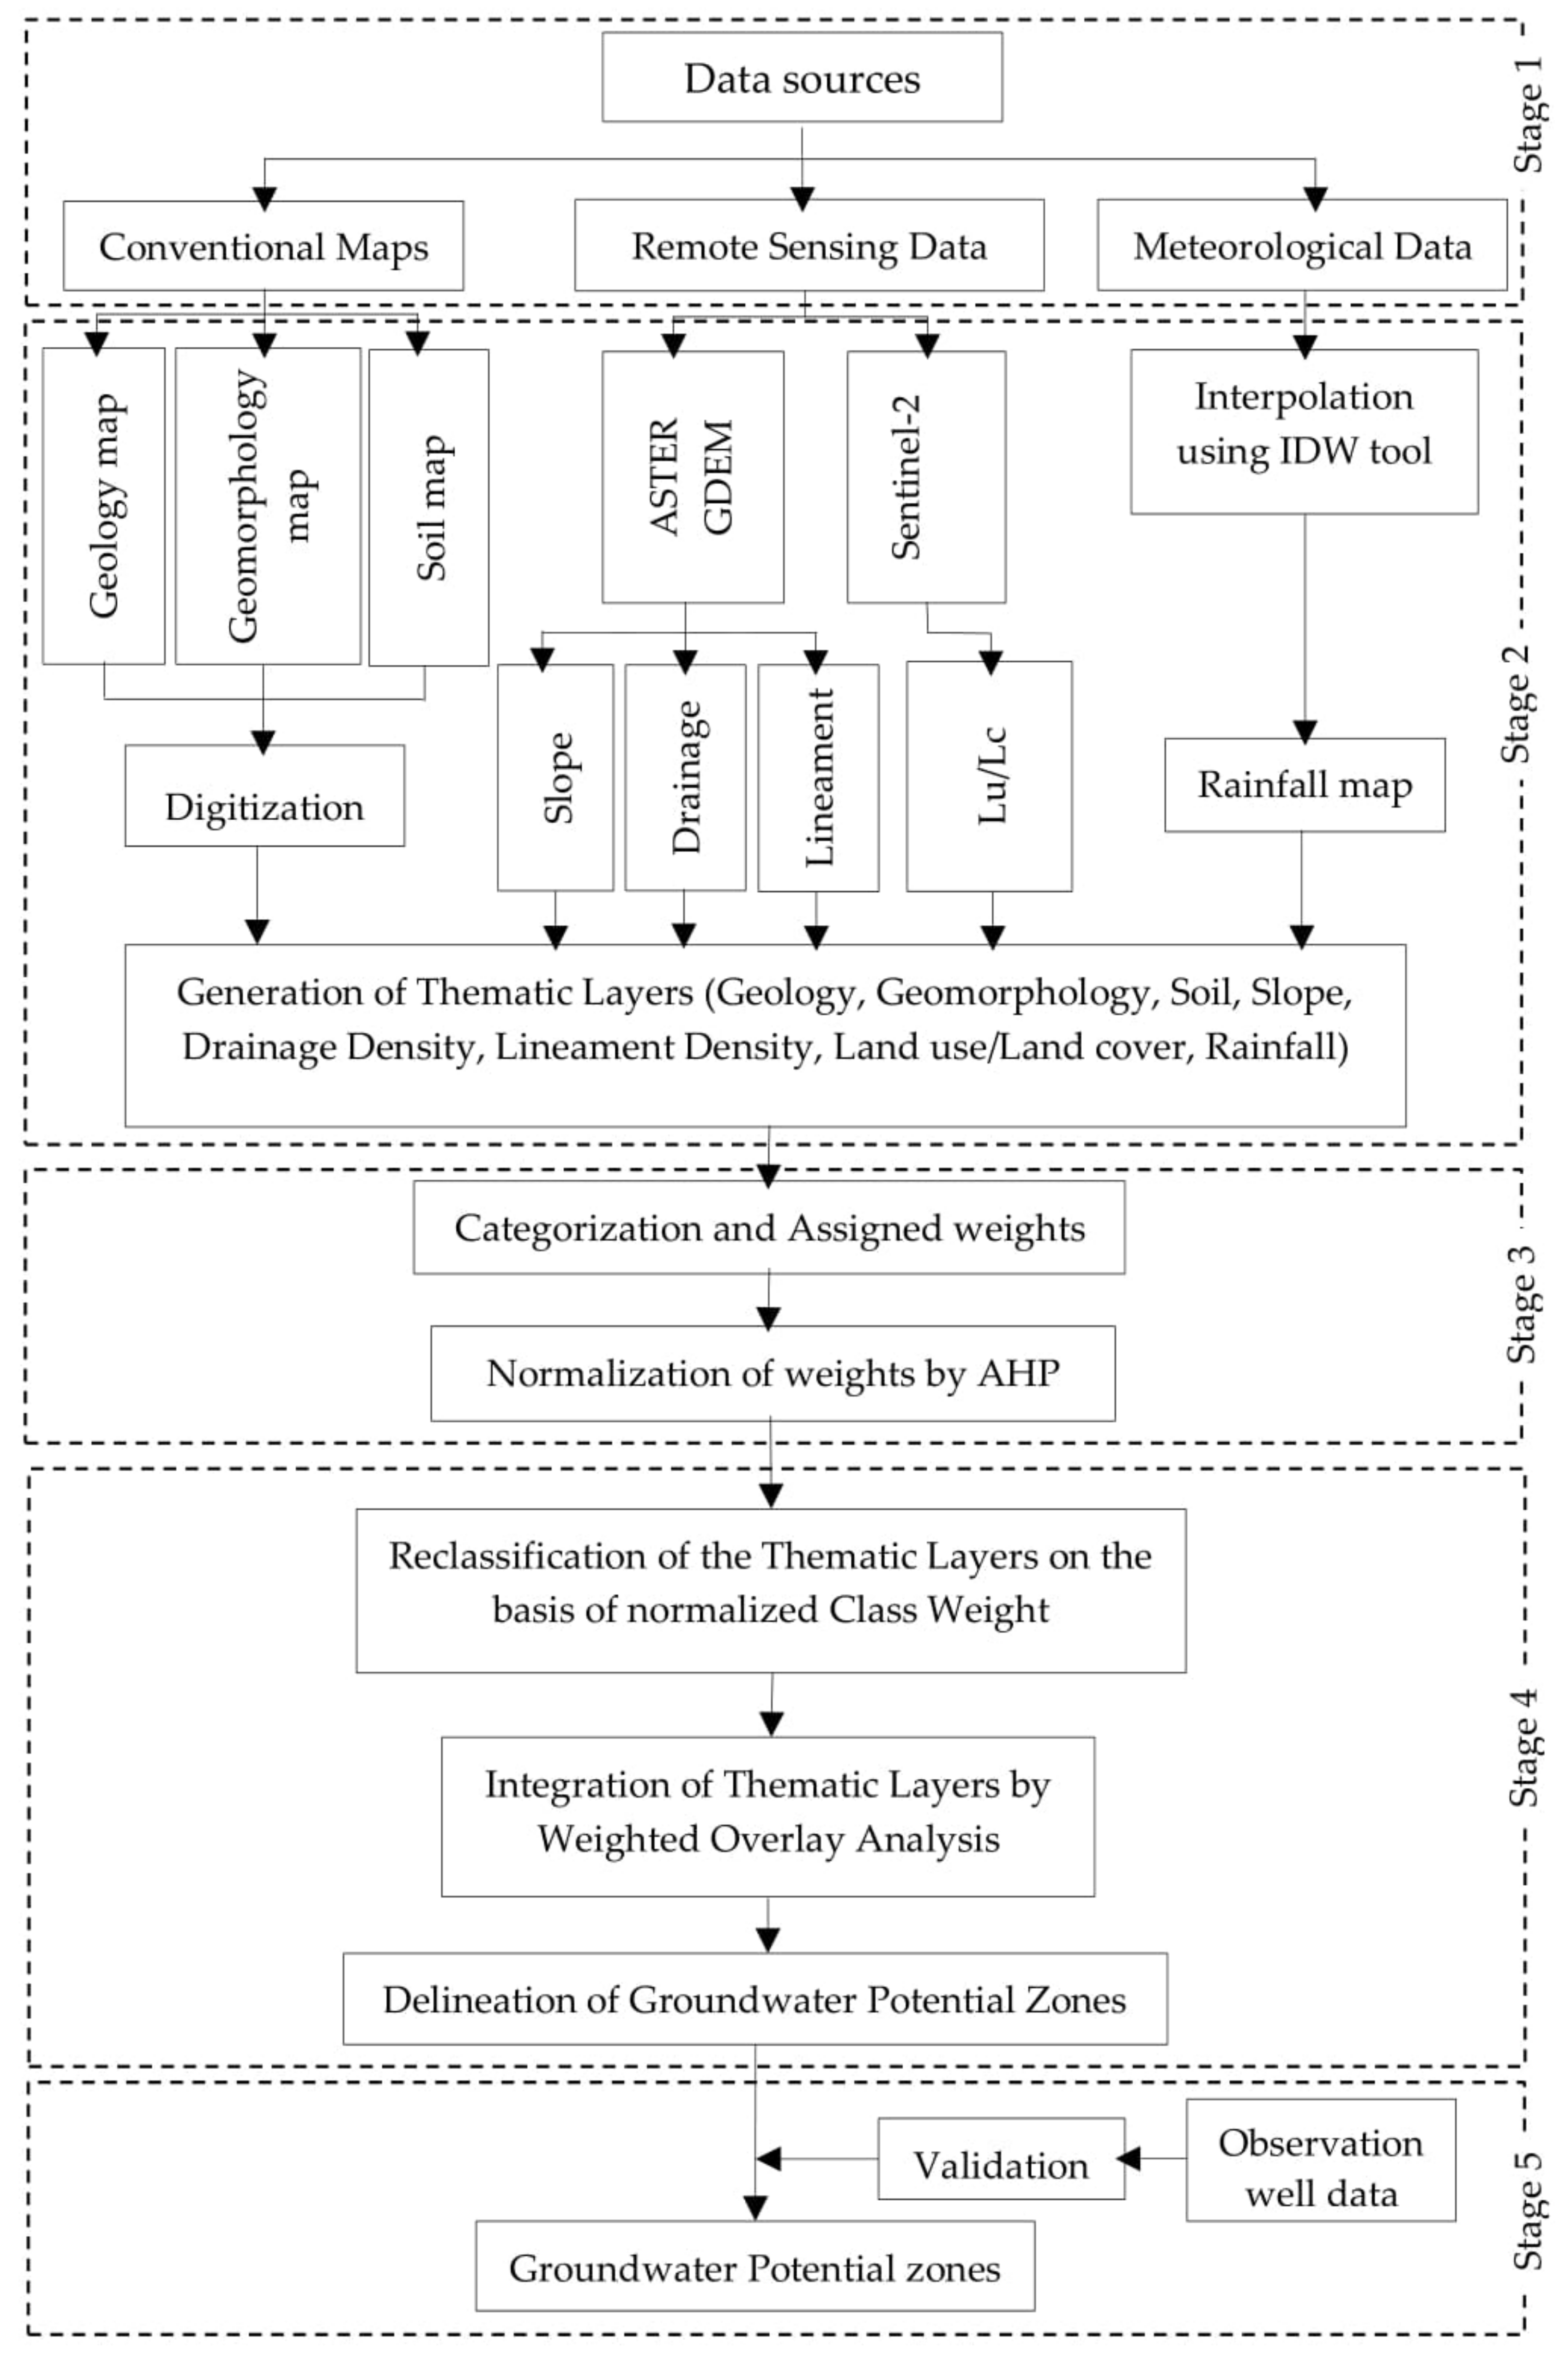
2. Materials and Methods

2.1. Study Area

Kilinochchi district is situated in the Northern Province of Sri Lanka and bounded in north and east by Jaffna district, and on the south by Mullaitivu district and on the east by the Indian Ocean. It lies between the north latitudes 9°12′30″ and 9°41′00″ and east longitude 79°58′30″ and 80°37′30″ and spread over 1237.11 km2 (Figure 1). The study area falls within the dry zone (annual average rainfall of <1750 mm) that extends over two-thirds of Sri Lanka, covering the northwestern, north-central, northern, northeastern, eastern, and southeastern regions of the country [60] and consists of two types of aquifers: deep confined aquifers and shallow regolith aquifer of the Hard Rock Region [14]. The average annual rainfall of the district is 1520.57 mm. The monthly mean temperature is between 25 °C and 30 °C [61]. Geologically, the major part of the Kilinochchi district constitutes alluvial and lagoonal clay, silt sand, whereas the western parts represent red earth and red and brown sand. Jaffna limestone (Minihagalkanda Beds), undifferentiated Vijayan gneiss with trend lines, beach, and dune sand are also seen. The elevation of the district ranges from 49.63 m in the southern part to less than 6.6 m in the northern region. The topography of the area exhibits relatively flat terrain covering a larger part of the coastal zone. The Kilinochchi district is occupied by seasonal rivers and streams, which flow northwards to the Indian Ocean. The soil type of the district is dominated by red-yellow latosols and followed by alluvial soils of variable texture, alkali and saline soils of varying texture (Solodized Solonetz and Solonchaks), sand regosols on the recent beach and dune sands and red-yellow podzolic soils.

2.2. Methods

Integration of RS-GIS and AHP technique can be described as a process that translates and harmonizes geographical data and weightage ranking to extract information for decision making (Figure 2) [9]. The overall concept of the study included integrating eight thematic layers of geology, geomorphology, soil, drainage, slope, land use and land cover, rainfall, lineament [13,14,23] processed by weighted overlay analysis using ArcGIS 10.4.1 to generate a potential groundwater zone (Figure 3). The potential groundwater zones have been delineated using integrated RS-GIS, and AHP techniques. Integrating remote sensing data into the GIS platform is one of the viable options for delineating potential groundwater zones. Required data were gathered from various government agencies, field surveys, and publicly available satellite imagery on the United States Geological Survey (USGS) Earth Explorer website. Thematic layers preparation consists of digital image processing, digitizing existing maps, and field data. All data are geo-rectified and projected to GCS WGS 84 UTM zone 44 North for easy handling in ArcGIS 10.4.1. The present analysis has been based on several types of data from different sources. Table 2 provides a detailed summary of the data sources. Drainage density map and lineament density map were produced using a line density analysis tool in ArcGIS 10.4.1.
Advanced Spaceborne Thermal Emission and Reflection Radiometer—Global Digital Elevation Model (ASTER- GDEM) with 30 m resolution was used to generate a slope map, drainage density map, and lineament map. Those maps were then reclassified to generate the map. The rainfall data were spatially interpolated with inverse distance weighting (IDW) to obtain the rainfall distribution map. IDW interpolation uses a weighted collection of sample points to calculate cell values. Its general concept is that the attribute value of an unsampled location is the weighted average of known values in the surrounding area [67]. The idea is that sampled points closer to the unsampled point are more comparable in their value than those further away. In this study, the deterministic model of the IDW method is used to interpolate spatial data based on the concept of distance weighting. Long-term observed rainfall data were required for analysis in utilizing IDW to interpolate spatial rainfall [37,68,69]. As a result, this study used average rainfall data from 1990 to 2020 over 30 years. It can predict unknown spatial rainfall data using available data from nearby places [37,68].
An accuracy assessment of land use and land cover (LULC) was conducted to assess the accuracy level of the resulting classes. A stratified random sampling method was applied to generate 250 random points, and Google Earth imagery was used as the ground truth reference to examine the random points. The date of the Google Earth imagery was concurrent with the LULC map. A confusion matrix was applied to compute the user’s accuracy, producer’s accuracy, and overall accuracy for the LULC map with the data obtained from comparisons between the reference and actual points. The accuracy was found to be 88% overall classification accuracy and 0.84 overall kappa coefficient. The overall accuracy of 85% is often considered explicitly as the standard of acceptability of thematic mapping using remotely sensed images [70]. The following equation was applied to calculate the overall accuracy [71].
O A = 1 N i = 1 r n i i  
where OA is overall accuracy, nii is the number of correctly classified pixels, N is the total number of pixels, r is the number of rows.
The key factors influencing the groundwater potential are geology, geomorphology, soil, drainage density, slope, land use and land cover, rainfall, and lineament density [50,58,60,72,73,74,75,76]. Therefore, eight thematic layers (parameters) such as geology (Ge), geomorphology (Gm), land use/land cover (LuLc), soil types (St), drainage density (Dd), slope (Sp), lineament (Lt), and rainfall (Rf) are considered to delineate the potential groundwater zones in the Kilinochchi district. Based on previous literature studies and expert opinion obtained through snowball sampling from 17 experts from various professions, Saaty’s scale was applied to the assigned weights of the chosen eight thematic layers and their features with respect to their influence on groundwater storage (Table 3). The highest and lowest weights were allocated to the themes of the strong groundwater potential and weakest groundwater potential, respectively [1,4,56,74,76,77].
The methodology adopted for the present study is shown in Figure 3. These layers are geo-referenced and vectorized from various spatial data sources such as the topographic sheet scaled 1:50,000 of Survey Department of Sri Lanka, Geological Map of Sri Lanka, Geomorphological Map of Sri Lanka, Soil Map of Sri Lanka of Geological Survey and Mines Bureau of Sri Lanka, and satellite images (ASTER GDEM and Sentinel-2) of USGS. These thematic layers were converted into a raster format of 30 m resolution and subjected to weighted overlay analysis in Arc GIS 10.4 environment. Field data have been used to verify the accuracy of the groundwater potential map to ensure that the specified areas meet the conditions on the field.

2.2.1. Assignment of Weight and Weight Normalization

The multi-criteria decision analysis (MCDA) is a generally recognized and highly appropriate technique for complex decision-making problems. Standardized weights were allocated by using Saaty’s scale (1980). The AHP helps to find out the weight of criterion by pairwise comparison [78,79]. The AHP is a concept of measurement by pairwise comparison matrix (PCM) and is based on the judgment of experts to derive priority weights [74]. The worldwide academic network progressed the integrated GIS and AHP technique to investigate complex spatial issues [50,56,72,74,75,80,81]. PCM for thematic layer, viz. geology, geomorphology, soil, drainage density, slope, land use and land cover, rainfall, and lineament density, is calculated based on Saaty’s 1–9 scale weights. Local knowledge and expertise are used to assess the value of the Saaty’s scale of each thematic layer. The weights were given according to their potential for groundwater recharge. The high weight is assigned to the themes of good groundwater potential, and the least weight is assigned to poor groundwater potential.
The relative weight matrix and normalized weights were determined based on the PCM to determine the percentage of impact on groundwater recharging of the thematic layers (Table 4).
The key principle for checking the comparison order is that the consistency ratio (CR) not equal to 0.1 indicates a satisfactory reciprocal matrix. The ratio above 0.1 indicates the change of the PCM [74]. The CR is determined using the following equation:
CR = CI RI
where RI is the random index, the value of RI for different n values depends on the order of the matrix, and CI is the consistency index which can be expressed as follows:
CI = λ max n n 1
Here, (λmax) is a principal eigenvalue, n is the number of factors, and CI is the consistency index. The CR value for consistent weights should be below 0.10; in the absence of this, corresponding weights should be re-examined to prevent inconsistency [78]. In this study, the CR is found to be 0.088 (λmax = 8.86, n = 8, RI = 1.41, CI = 0.123); which indicates a good consistency in the pairwise matrix comparison (Table 4). Hence, the AHP technique exhibits reasonable precise spatial prediction of groundwater probability.

2.2.2. Normalized Weights of Different Features of Thematic Layers

The attributes of each of the thematic maps were assigned a weight of 1–5 (1 denotes very low, 2 implies low, 3 indicates moderate, 4 represents high, and 5 denotes very high), considering its influence on the occurrence of groundwater [12,50,56,77,82,83]. Table 5 displays the ranks of different features of the individual themes and their normalized weights regarding groundwater potentiality. Every thematic layer has five classes, and their interdependence is complicated. Therefore, the relationship between different features of the individual themes is achieved using other ranks and distinguished by using AHP.

2.2.3. Groundwater Potential Index

The groundwater potential index (GWPI) is a dimensionless quantity that helps predict the potential groundwater zones in an area [4,50,56,72,74]. The weighted linear combination method was used to estimate the GWPI [84,85]. The following equation was applied to integrate all the themes for obtaining the potential groundwater zone as stated below:
GWPI = (GmwGmwi) + (GewGewi) + (LuLcwLuLcwi) + (DdwDdwi) + (SpwSpwi) + (LdwLdwi) + (StwStwi) + (RfwRfwi),
where Ge stands for geology, Gm stands for geomorphology, LuLc stands for land use/land cover, Dd stands for drainage density, Sp stands for the slope, Ld stands for lineament density, St stands for soil type, Rf stands for rainfall, w stands for the normalized weight of a theme, and wi stands for the normalized weight of each class.

3. Results

3.1. Factors Affecting the Groundwater Potentiality in the Study Area

3.1.1. Geology

Geology determines the aquifers which store groundwater. The porosity and permeability of a formation assess its quality as an aquifer [57,73]. The spatial distribution of groundwater is primarily influenced by the geological characteristics of an area [57,74,75,86,87]. The geology map of the Kilinochchi district was prepared by digitizing the geology map of Sri Lanka, published by the Geological Survey and Mines Bureau of Sri Lanka [63]. Five types of geology, namely alluvial and lagoonal clay silt sand and red earth, red and brown sand, beach and dune sand, Miocene limestone (Jaffna limestone), and undifferentiated Vijayan gneiss with trend lines are found in the study area. The detailed geological map of the study area is presented in Figure 4. In general, this area belongs to Phanerozoic rock and Precambrian rock. The Phanerozoic rock comprises Alluvial and lagoonal clay silt sand, red earth red and brown sand, beach and dune sand, Miocene limestone (Jaffna limestone). Precambrian rock consists of undifferentiated Vijayan gneiss with trend lines. Alluvial and lagoonal clay silt sand distributed most of the study area predominantly. Although alluvial and lagoonal clay silt is primarily found in the eastern part of the district, it is also distributed throughout the study area. The flow of seasonal rivers in the study area carry alluvial deposits, which are fine sediments with poor sorting order, varies in particle size from clay to sand. Groundwater exploration in this area is deemed relatively successful. The western part mainly comprises red earth, red and brown sand, which are sandstones having quartz and feldspar mineral compositions. It is red and brown in the hue in the studied area. These rock formations allow water and other fluids to percolate easily and are porous enough to retain significant amounts of water, making them valuable aquifers [88]. Beach and dune sand was found in the study area as patches. The water table is deeper beneath dunes and raised beaches [89]. The northeast coastal headland of the study region contains separated extensive coastal sand dune belts.
Miocene limestone (Jaffna limestone) found in the northern part has high groundwater potential. The limestone is a compact, firm, somewhat crystalline rock that dates back to the early Miocene period [88]. The zones having less compaction, a high degree of weathering, and a high degree of infiltration of runoff are more suitable for groundwater recharging [60]. Sedimentary rocks have higher primary porosity and permeability than other types of rocks [73]. Precambrian rock consists of undifferentiated Vijayan gneiss with trend lines, primarily granitic rocks with relatively limited porosity, including garnet and feldspar [88]. They are referred to as “poor aquifer zones.” Hence, the various rock units in the study area are assigned appropriate weights based on their textural properties and the potential for fractured zone formation. Based on the nature of increasing groundwater potentiality, the high weight was assigned to Miocene limestone (Jaffna limestone), whereas low weight was assigned to undifferentiated Vijayan gneiss (Table 4). The groundwater potential map validated with field observation reveals that Miocene limestone (Jaffna limestone) has the highest groundwater potential.

3.1.2. Geomorphology
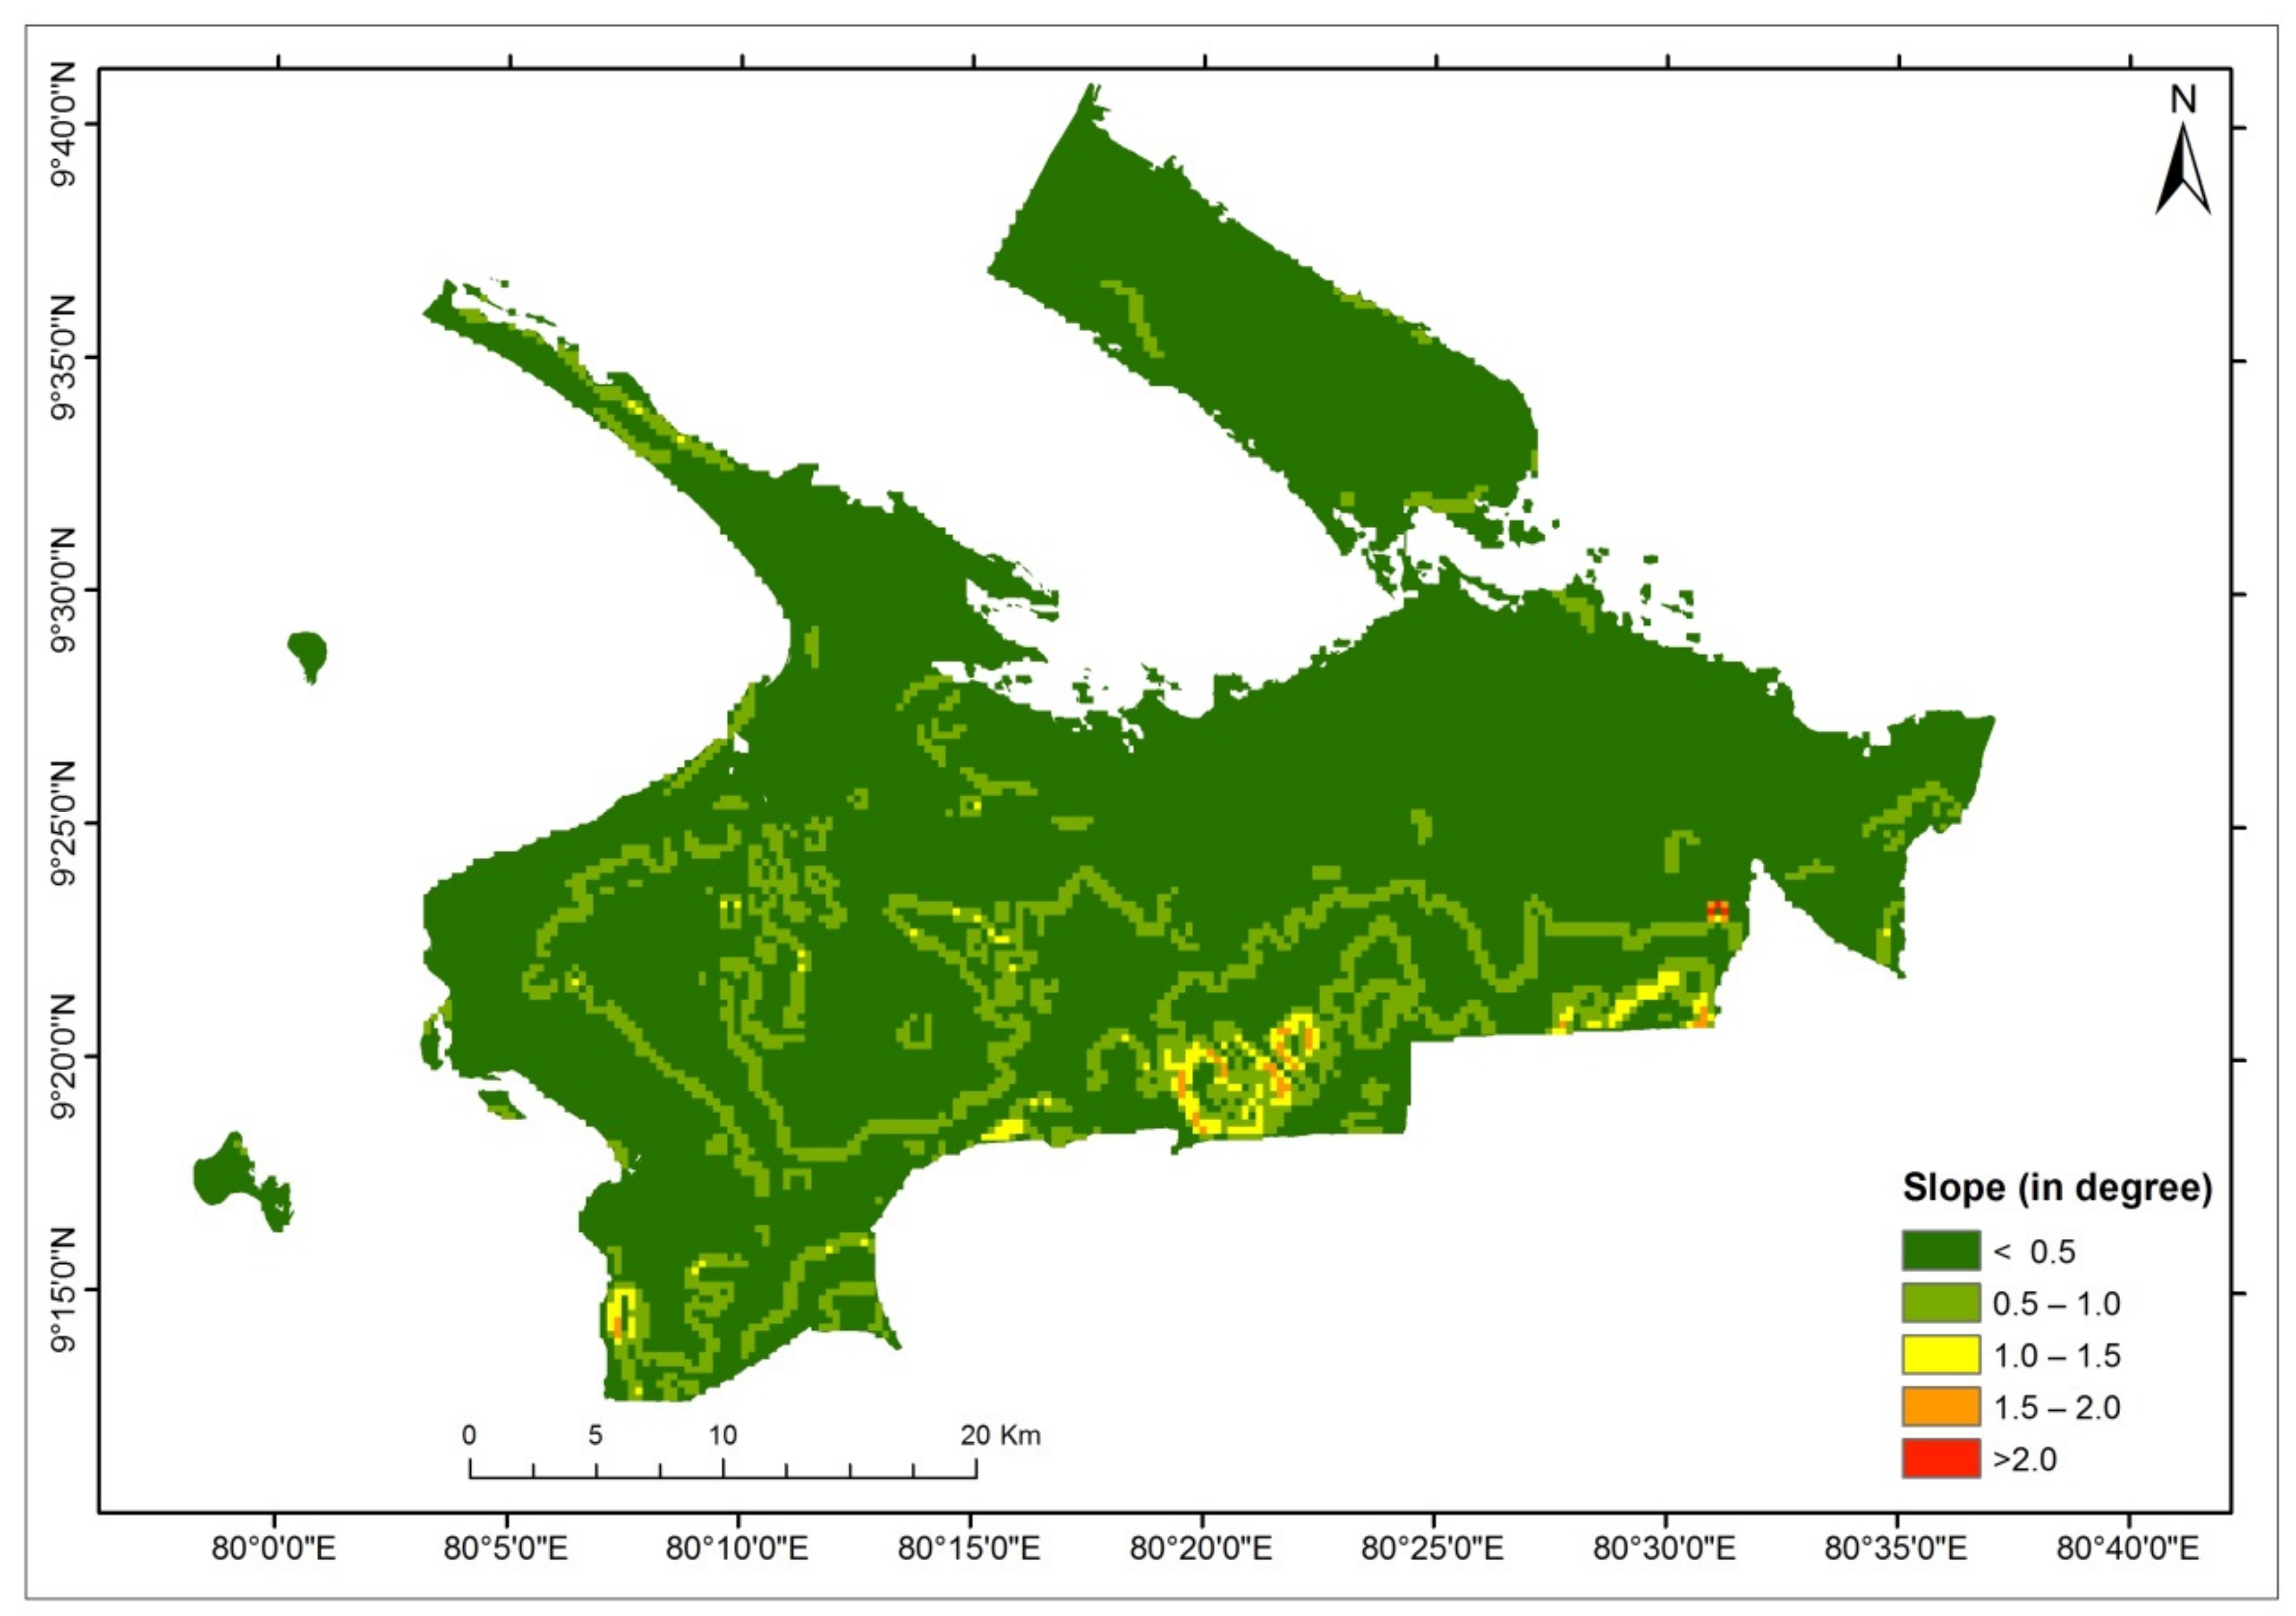
Geomorphology is a study of landforms that includes their description, species, and physical processes that have helped evaluate possible groundwater areas [57,74]. Geomorphological components are significant in hydro-geological investigations and the identification of groundwater resources [50,57,86]. Morphology has a positive influence on the percolation of water into the earth’s subsurface [56,76,90]. Geomorphology is considered an essential component for groundwater recharge as the evolution of landforms explains porous and permeable zones [60]. The geomorphology map of the Kilinochchi district was prepared by digitizing the geomorphology map of Sri Lanka, published by the Geological Survey and Mines Bureau of Sri Lanka [64]. The lithology and geological formation of the study area are highly influenced by geomorphology. Groundwater flow and storage are dominated by geomorphology in any location [91]. The primary geomorphological units of the study area are divided into five types: beach ridges, bars and spits, low plantation surface with inselbergs and thin soil, river plains and adjacent coastal lowlands, upwarped Pleistocene coastal plain, and plateau of Miocene limestones (Figure 5).
Coastal landforms of sandy beaches, ridges, bars and spits are found in the north and west part of the study region. Coastal barriers called beach ridges shift landward in response to changes in sea level, sediment supply, and coastal erosion [89]. They are the bi-directional transitional zone between terrestrial and marine processes. Sandy beaches are often located in bays with shallow water and low-energy waves. Tidal currents determine the directions of spits and bar growths. Waves and tides cannot cross a spit; therefore, the water behind a spit is very sheltered. Therefore the impacts of beach ridges, bars, and spits on the groundwater are significant in the study area.
Low plantation surface with inselbergs and thin soil is located in the south of the study area. These are erosional remains of the earliest plain surface, characterized by domes of Vijayan gneiss and quartzite. The drought-tolerant vegetation is more prevalent in this area. The study area consists of eroded terrain and erosional remains (inselbergs), accelerating runoff water from the steepness. Thus, the groundwater recharge capacity in erosional remnants was limited [92]. River plains and coastal lowlands cover the major portion of the study area. Most of the rivers are seasonal and have seasonal impacts on the groundwater too. The rivers carry fluvial deposits, and river beds accumulate groundwater during the Northeast monsoon from November to February. An extensive belt of Miocene (5–20 million years ago) limestone is found along the Northeast coast, overlain in some areas by Pleistocene (1 million years ago) deposits, consisting of relatively flat terrain and rising significantly above the surrounding area with some steep slopes. Miocene limestones have a series of openings or caves that make an excellent aquifer which raises the groundwater level.
The major portion is occupied by river plains and adjacent coastal lowlands in the district, while the western part is predominantly formed upwarped Pleistocene coastal plain (Figure 5). Geomorphological features are weighted in terms of their importance over groundwater occurrence (Table 5). Among these morphological features, the plateau of Miocene limestones has been assigned high weight as it has good potential for groundwater. Still, upwarped Pleistocene coastal plain landforms are assigned low weight as they are unsuitable for potential groundwater zones.

3.1.3. Slope

The slope (the rate of elevation change) is also a key factor in identifying potential groundwater zones [1]. It can be used as an indicator for demarcating potential groundwater zones as it directly controls the groundwater recharge rate [50]. Generally, an inverse relationship can be seen between the slope and the infiltration rate. Surface water penetration is regulated directly by the slope gradient [1,50,75,76,93]. Steep slope experiences a low penetration level due to the rapid flow of water downwards and insufficient time for infiltration, whereas the flat surface facilitates groundwater recharge by retaining rainwater [50,75,94]. The slope map of the Kilinochchi district was derived from the ASTER- GDEM. The slope gradient of the district ranges from <0.50 to >2.00. The slope of the entire district has been categorized into five classes, viz, <0.50, 0.50–10, 10–1.50, 1.50–2.00, and >2.00. Weights were assigned based on the slope categories given in Figure 6. High weight was allocated for lower slopes due to the higher groundwater recharge rate and vice versa (Table 5).

3.1.4. Soil

Surface water penetration into the aquifers is controlled by the soil [76]. In the unsaturated zone, moisture content, infiltration rate, grain size, and soil composition influence the groundwater movement [50,57,95]. Soil texture affects infiltration rate since the texture varies with porosity and permeability [57,75]. The soil map of the Kilinochchi district was prepared by digitizing the soil map of Sri Lanka, published by the Department of Irrigation Sri Lanka [65]. Five soil types are described in the study area: alkali and saline soils of variable texture (Solodized solonetz and solonchaks), Alluvial soils of variable texture, and red-yellow podzolic soils, red-yellow latosols, and sand regosols on the recent beach and dune sands (Figure 6). The soil type analysis shows that the study area is primarily covered by red-yellow latosols followed by alkali and saline soils of variable texture (Solodized solonetz and solonchaks), which were observed along the northern and western margin of the coast. Alluvial soils of variable texture mainly cover the middle and eastern parts. The sand regosols on the recent beach and dune sands also occur in the northern boundary of the area. The red-yellow podzolic soil covers the smaller portion in the southern part of the study area (Figure 7). The weights of soils are assigned according to their degree of infiltration [74,96]. The sand regosols on the recent beach and dune sands soil have a high infiltration rate and, therefore, higher priority. In contrast, the red-yellow latosols soil has the lowest infiltration rate and, therefore, is given as low priority (Table 5).

3.1.5. Drainage Density

Drainage density is one of the influential factors in groundwater potential that control surface runoff and permeability [57,74]. Drainage density and the drainage structure are generally controlled by geology, slopes, and structures [57,74]. Drainage density is the proximity of the distance between stream channels, and it indicates the ratio between the total stream length and total area [1,72,87,97]. The drainage density of the Kilinochchi district was prepared from the ASTER GDEM in ArcGIS 10.4. platform. Figure 8 shows the drainage density of the study area. The less permeable layer below the high drainage density area increases surface runoff, indicating less groundwater potential. Therefore, the region with a high drainage density is unlikely to suit groundwater [56]. The drainage density varies between <28.48 and 113.89 km/km2 in the study area and are categorized into five categories namely <28.47 km/km2, 28.47–56.94 km/km2, 56.94–85.42 km/km2, 85.42–113.89 km/km2, >113.89 km/km2. High weights have been allocated to the low-drainage area for potential groundwater delineation, while high drainage area has been assigned low weights (Table 5).

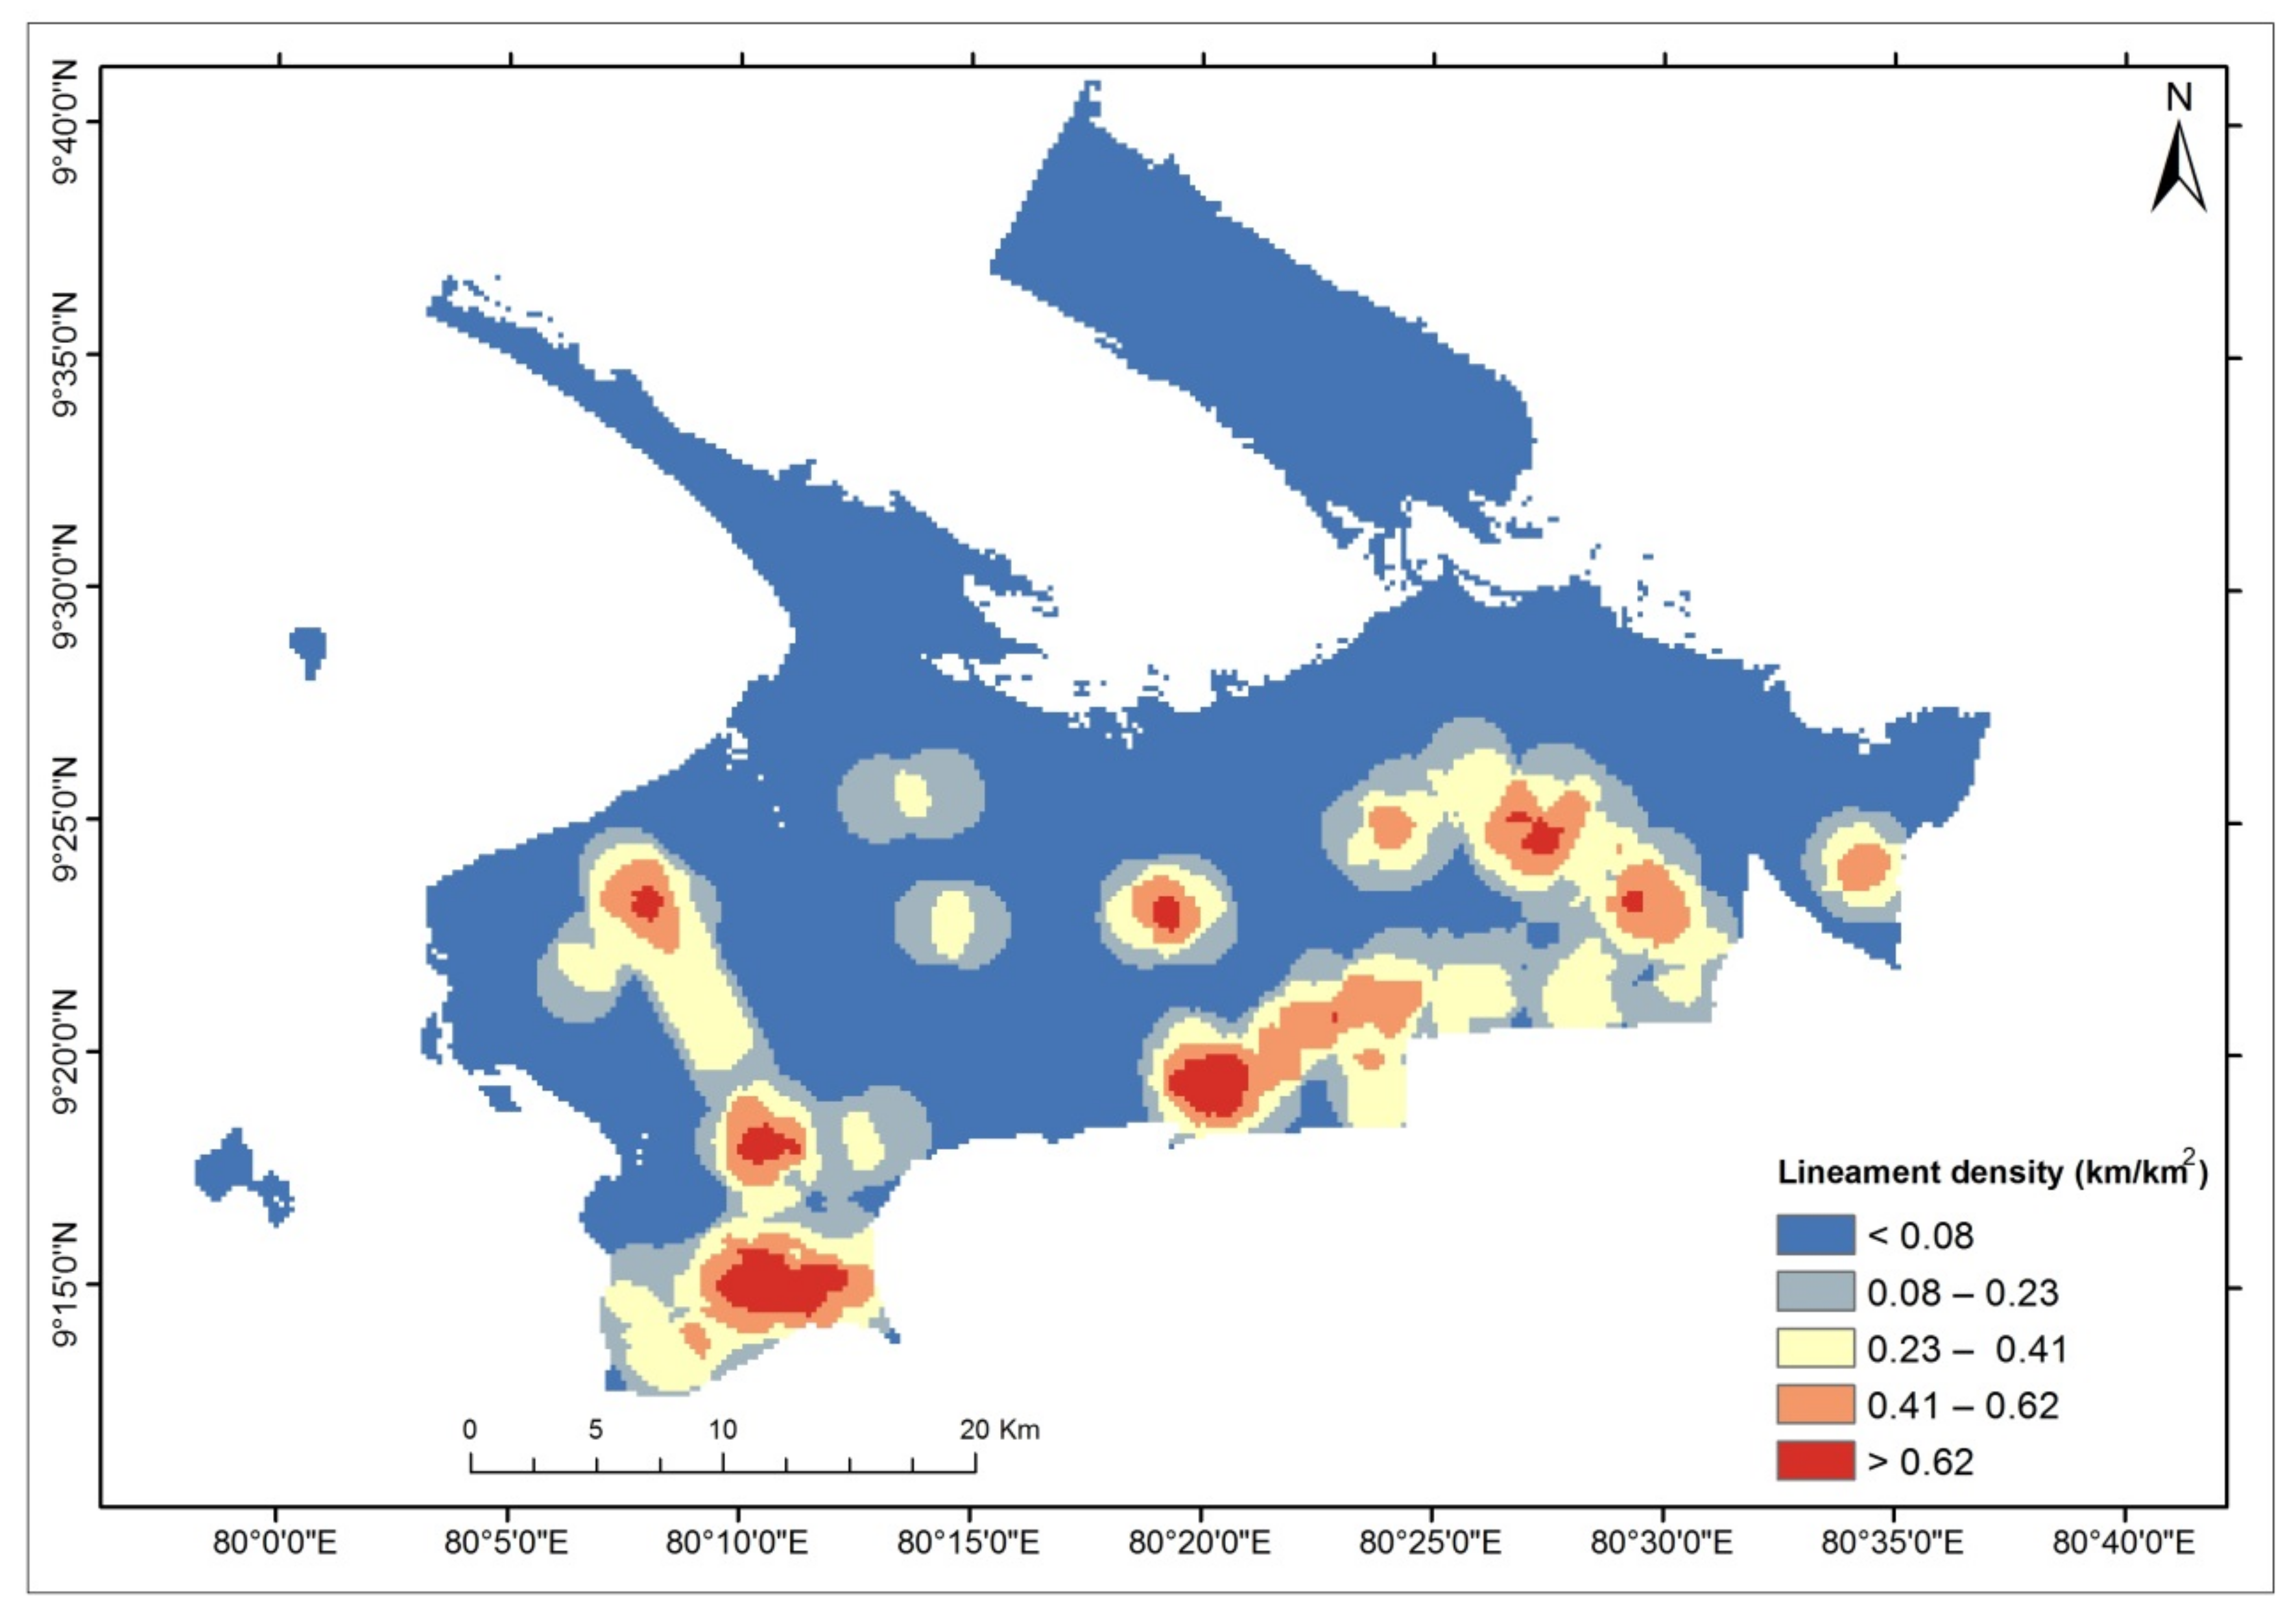
3.1.6. Lineament Density

Linear and curvilinear structural features of an area support groundwater movement and infiltration [10,50,56,93,98]. Higher lineament densities are considered ideal for the development of groundwater [83]. The lineament map of the study area was generated from ASTER GDEM. The lineament density of the study area varies from <0.08 to >0.62 km/km2 (Figure 9). The lineament density, shown in Figure 9, is natural, linear or curvilinear features, and was classified into five classes namely, <0.08 km/km2, 0.08–0.23 km/km2, 0.23–0.41 km/km2, 0.41–0.62 km/km2, >0.62 km/km2. The weights were assigned based on density. Low lineament density was assigned low weight, whereas high weight was assigned to high lineament density (Table 5).

3.1.7. Rainfall

Rainfall impacts significantly the hydrological cycle, which has a dominant effect on the area’s groundwater capacity [1,82,97]. The amount of infiltration heavily depends on the intensity and duration of rainfall [1,87]. About 75% of the district’s total rainfall is from the northeast monsoon from September to December [61]. There are only a few rain gauge stations in the Kilinochchi district. Annual rainfall data was obtained from three stations: Iranamadu, Akkarayan, and Kariyalainagapaduvan. The rainfall data were spatially interpolated with IDW to get the rainfall distribution map. The yearly precipitation of the study area varies between 94 and 107 mm [61] and is classified into five categories as <97 mm, 97–100 mm, 100–103 mm, 103–106 mm, >106 mm (Figure 10). The weights were assigned based on the intensity and its potential to groundwater. The high intensity of rainfall was assigned high weight, whereas low weight was allocated to the low intensity (Table 5). The thematic rainfall map of the Kilinochchi district indicates that although there is high rainfall in the eastern region, the western part of the district has relatively low rainfall (Figure 10).

3.1.8. Land Use/Land Cover

Groundwater recharge depends on the area’s LULC [10,50]. It provides essential information on infiltration, soil moisture, groundwater, surface water, etc. [57,99]. The land use and change map was generated from the Sentinel-2 imagery of May 2020, acquired from USGS Earth Explorer and classified using supervised classification ArcGIS 10.4. Forests, agriculture and fallow lands, barren land, settlements, and water bodies are the main categories of land used found in the area (Figure 11). The land used for water bodies and vegetation is highly suitable for groundwater recharge [57]. Water bodies retain surface water during the monsoon period, and forest cover increases infiltration by minimizing runoff. The land used for agricultural purposes can be categorized as moderately suitable land for groundwater recharge. The built-up area is categorized as the least suitable area for groundwater recharge [75]. The weights were given according to their potential for groundwater recharge. The water bodies are allocated high weight, and the settlements are allocated the least weight (Table 5).

4. Discussion

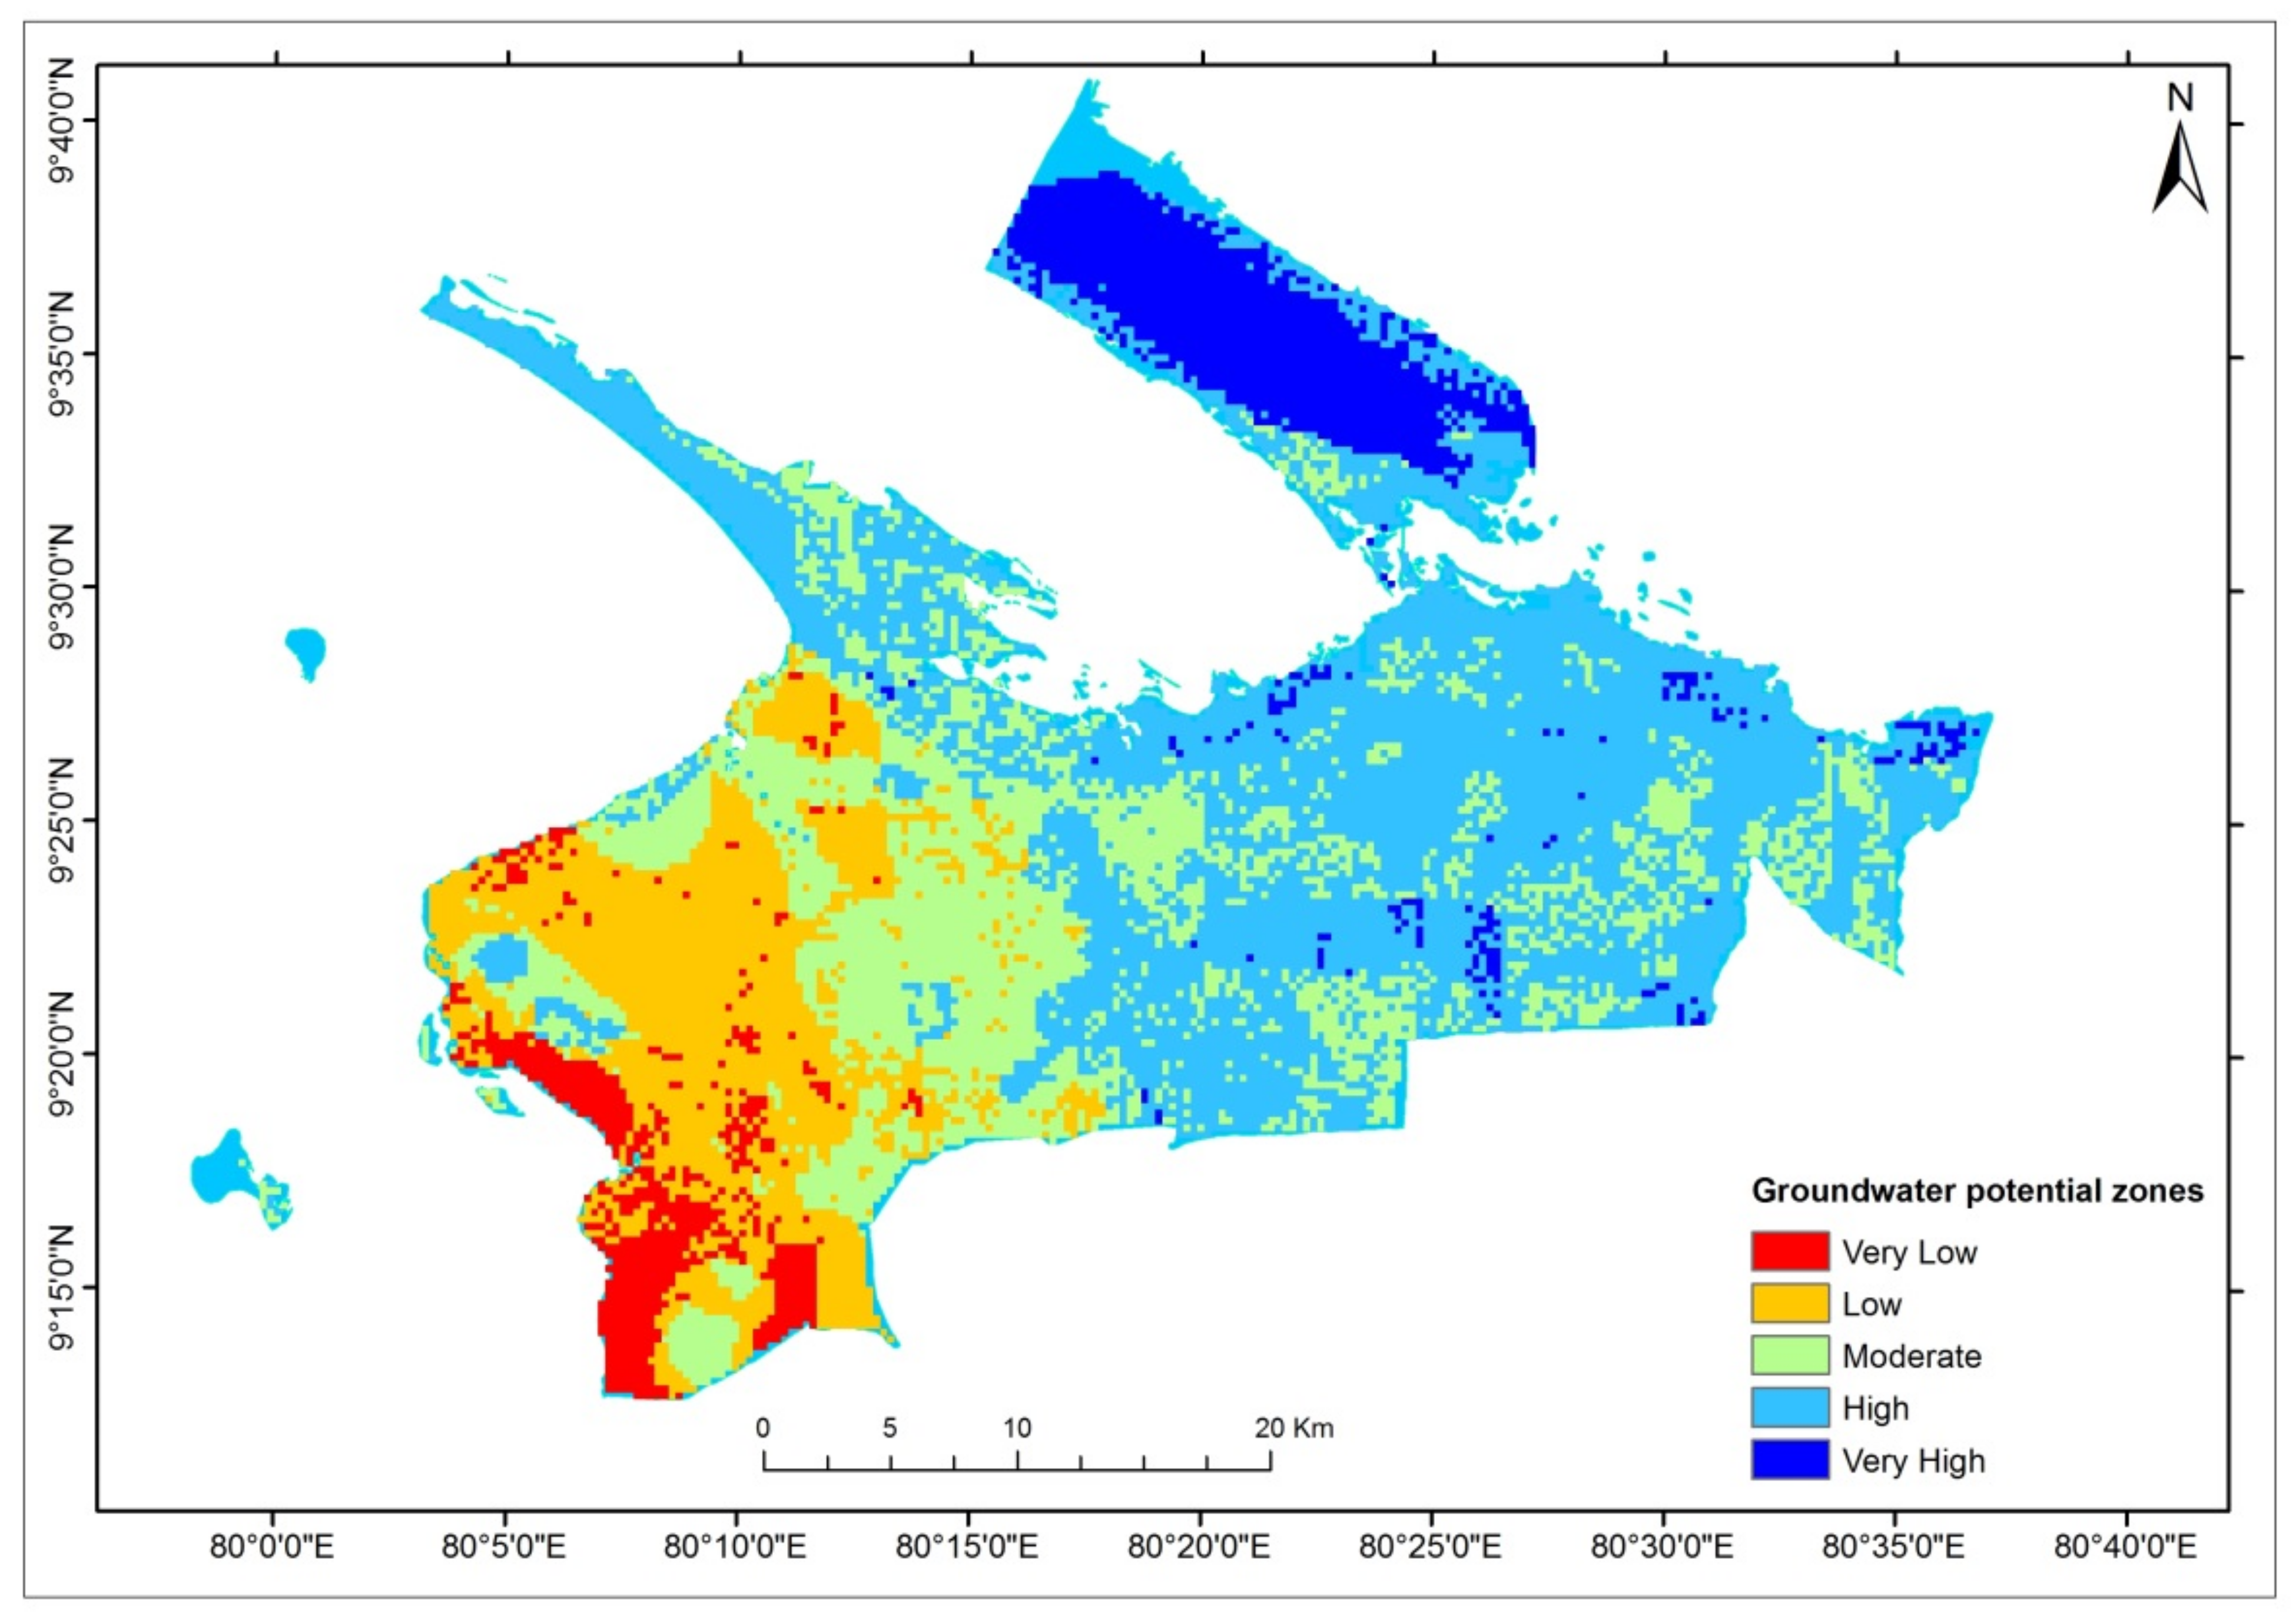
4.1. Delineation of Potential Groundwater Zone

Geomorphology, geology, soil, and rainfall play an essential role in the study area’s groundwater potential. The integrated RS, GIS, and AHP technical methods have been applied to delineate potential groundwater zones. In PCM, the expert’s opinions and field knowledge assigned importance to each theme on Saaty’s scale. Geology obtained the highest normalized weight, followed by rainfall, geomorphology, land use land cover, lineament density, soil, slope, and drainage density.
The groundwater potential map are classified into five classes namely very high (111.26 km2), high (507.74 km2), moderate (309.89 km2), low (207.78 km2), and very low (59.12 km2) covering about 9%, 42%, 26%, 17%, and 5% respectively (Table 6). The normalized weights of the eight thematic layers indicate that geology and rainfall influence more than other factors in the occurrence of the potential groundwater zones (Table 3).
The map shown in Figure 12 gives an overview of groundwater potential in the study area. Groundwater potentiality map of Kilinochchi district shows that the very high groundwater potential zone is predominantly found in the northeastern part, which includes several Grama Niladhari (GN) divisions (e.g., Masar, Soranpattu, Mullaiyadi, Pulopalai, Palai town, Tharmakerny, Kachcharvely, Vembatukerny, Kilali) under Pachchilaipalli Divisional Secretariat (DS) due to high rainfall (103 mm-106 mm), Jaffna limestone, sand regosols on the recent beach and dune sands, flat terrain, and plateau of Miocene limestones. It indicates that rainfall, geology, geomorphology, and soil significantly contribute to groundwater augmentation in the Kilinochchi district. The upper northwestern, middle and eastern parts of the study area (Karachchi DS division, Kandawalai DS division and Northern part of Poonakary DS division) generally have high groundwater potential due to high annual average rainfall (>106 mm), flat terrain with less than 0.5-degree slope, Alluvial and lagoonal clay, silt sand, and agricultural land. Moderate groundwater potential zones exist mainly in the west part and small patches in the central and eastern parts of the study area (Poonakary DS division). As a result of less annual average rainfall (<94 mm), red-yellow Latosols soil, upwarped Pleistocene coastal plain, red earth, red and brown sand, lithology with less permeability, the western part of the study area (Poonakary DS division) is dominated by low and shallow groundwater potential areas. Furthermore, the groundwater potential map shows that, in addition to the significant control of geology and rainfall, the distribution of groundwater is influenced by land use/land cover, geomorphology, and soil. In addition, the area is underlain by red earth, red and brown sand in the west part of the study area, characterized by relatively lower groundwater potential zones. However, this area comes under a moderate groundwater potential zone because of forests with a high infiltration rate.

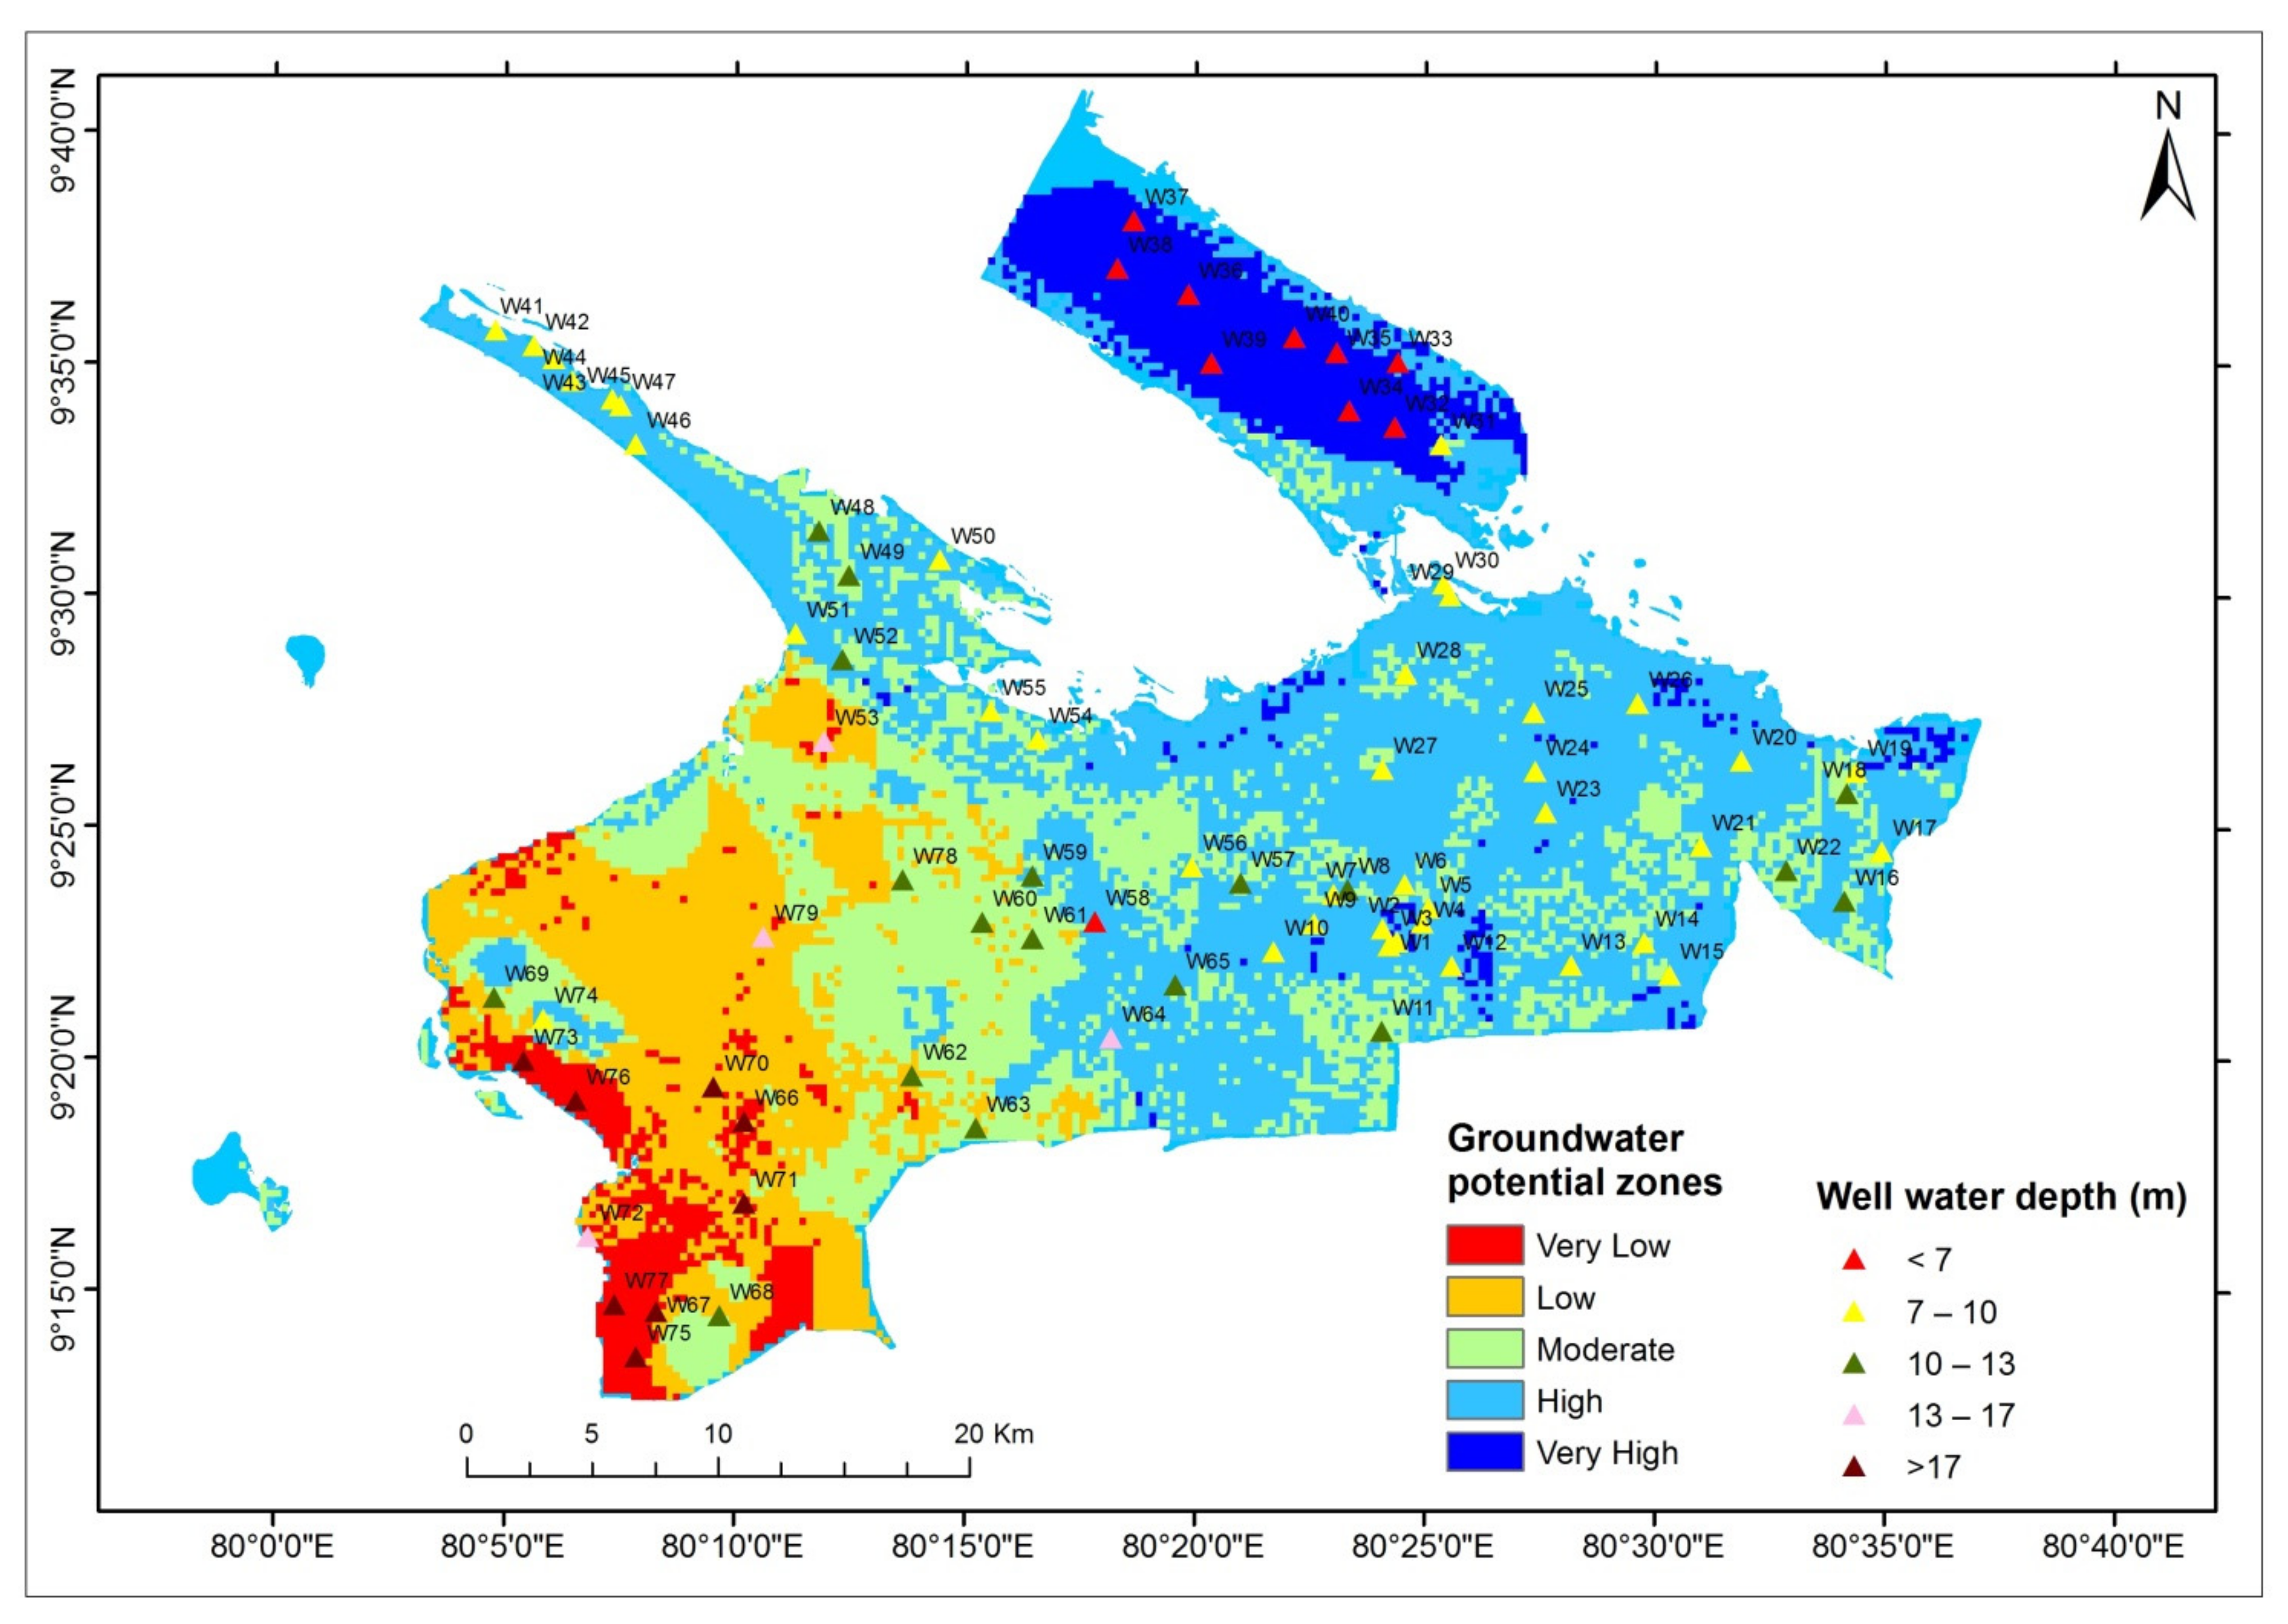
4.2. Validation of the Groundwater Potentiality

Validation of the result is more important to have scientific significance [82,100]. Thus, during the pre-monsoon season between March 2020 and August 2020, a field survey was conducted to determine the water table depth throughout the study area. The stratified random sample was used to choose 79 wells, and the coordinates of those wells were collected using a portable GPS. In addition, the depth to the water level of 79 wells was measured in feet (later converted to meters). According to the survey, the depth of the well water ranged from 5.3 m to 19.2 m. The observed wells were classified into five groups in an equal interval based on well water depth [37], including very high groundwater potential (<7 m), high groundwater potential (7–10 m), moderate groundwater potential (10–13 m), low groundwater potential (13–17 m), and very low groundwater potential (<17 m). To check the accuracy of the map, the wells’ water level was cross-checked against the prepared groundwater potential maps [75].
The wells’ water depth data was used as a reference point to check the accuracy of delineated potential groundwater zones. The wells’ water depth data was overlaid with the potential groundwater zones (Figure 13) as applied in several studies [59,101]. According to the well water depth, the groundwater potentiality was very high in the area where well water depth was relatively shallow. Nine out of ten wells with less than seven meters of depth are in the very high groundwater potential zone, while one well is in the high groundwater potential zone. Twenty-nine of the thirty-nine wells with a depth of 7–10 m are in the high groundwater potential zone, while seven wells are in the moderate groundwater potential zone, and three wells are in the very high groundwater potential zone. Sixteen of the eighteen wells with a depth of 10–13 m are in the moderate groundwater potential zone, while two wells are in the low groundwater potential zone. Three of the four wells with depths of 13–17 m are in the low groundwater potential zone, while one is in the extremely low groundwater potential zone. Seven of eight wells with more than 17 m depth are in the low groundwater potential zone, whereas one well is in the high groundwater potential zone. The data found that sixty-four of the seventy-nine wells matched with potential groundwater zones. This suggests that 81 percent of the wells’ depth to water is associated with the specified potential groundwater zones. It can be concluded that the model-generated groundwater potential zones were consistent with existing well water data. The ROC curve yielded a similar result.
The receiver operating characteristics (ROC) curve, which is a widely accepted technique for validating accuracy, was used to assess the accuracy of the model used [59,102,103]. The relation between the area under curve (AUC) and prediction accuracy can be summarized as poor (0.5–0.6); average (0.6–0.7); good (0.7–0.8); very good (0.8–0.9); and excellent (0.9–1.0) [4,82]. The Kilinochchi district’s groundwater potential map has been validated by 79 wells (Figure 14). The true positive rate (sensitivity) is plotted to function the false-positive rate in a ROC curve for varying cut-off points of a parameter. Each ROC curve point represents a pair of sensitivities, which corresponds to a certain decision threshold. According to the ROC graph, the area under the curve is measured and indicates an AUC value of 0.818, referring to 81.8% of the prediction accuracy (Figure 14). Therefore, it can be implied that the methods used in this study exhibit an acceptable level of accuracy (AUC = 81.8%) in delineating potential groundwater zones. The findings show the capacity of RS-GIS and AHP techniques to determine possible groundwater zones, which will aid in determining the best places for groundwater extraction. The validation accuracy (81%) demonstrates that the methods and data used to delineate potential groundwater zones have produced accurate results by analyzing the extent of parameters’ fitness and comparing the weight of relevant factors.

5. Conclusions

The integrated RS-GIS and AHP techniques help identify the potential groundwater zone in a given area and provide reliable and cost-effective preliminary information about groundwater resources. An integrated platform of RS, GIS, and AHP techniques was used to prepare the groundwater potential map of the Kilinochchi district. The AHP technique allocated thematic layers weighted for the following categories: rainfall, geology, geomorphology, soil, drainage density, linear density, slope, and land use cover. All thematic layers were integrated into ArcGIS 10.4.1 platform and generated a groundwater potential map. The resultant map has five categories, namely very high (111.26 km2), high (507.74 km2), moderate (309.89 km2), low (207.78 km2), and very low (59.12 km2). The very high potential zone is located in the northeastern study area (Pachchilaipalli DS division), which is highly favorable for groundwater prospecting. Very low potential zones are mainly found in the extreme western part of the Poonakary DS division, which is the least favorable for groundwater prospecting. About 48% of the Kilinochchi district falls into moderate to very low groundwater potential zones that should require special actions to increase groundwater conditions. The overall result indicates that the groundwater of the Kilinochchi district is influenced mainly by rainfall, geology, and soil factors.
The ROC curve was eventually prepared to check the appropriateness of the approach used to delineate the potential groundwater zone. The validation result of GIS-based AHP indicates a reasonably good prediction accuracy of 81.8%. It can be implied that the methods used to delineate potential groundwater zones in the Kilinochchi district are reliable. The spatial distribution of the zones was highlighted through the investigation of groundwater potential in the Kilinochchi district. However, more research may be conducted on the quality and suitability of groundwater for many purposes, including drinking, agricultural, and industrial activities. Groundwater recharging has a significant impact on groundwater potential. As a result, a quantitative examination of groundwater recharge is recommended for future studies to empirically demonstrate the area’s groundwater potential. This research will help policymakers better manage the Kilinochchi district’s groundwater resources and give scope for further research into groundwater exploration in the area. Furthermore, previous research found that deforestation in Sri Lanka was more severe between 2010 and 2019, resulting in the conversion of 7597.9 ha of land into other landforms. As a result, it suggests that groundwater is becoming a more important source of water in Sri Lanka’s tropical dry zone [104]. Hence, more research on groundwater potential covering Sri Lanka’s entire tropical dry zone should be focused on in the future. The methodology, techniques, and results of the present study may be helpful to evaluate the potential groundwater zone in similar semi-arid drought-prone regions in Sri Lanka and around the world.

Author Contributions

The authors Vyddiyaratnam Pathmanandakumar and Nadarajapillai Thasarathan proposed the topic and spearheaded the data processing and analysis, as well as the writing of the manuscript; Manjula Ranagalage helped to edit the manuscript. All authors have read and agreed to the published version of the manuscript.

Funding

This research received no external funding.

Data Availability Statement

Not applicable.

Acknowledgments

The authors express their gratitude to the anonymous reviewers and the editor for their valuable comments and suggestions to improve the manuscript.

Conflicts of Interest

The authors declare no conflict of interest.

References

  1. Ibrahim-Bathis, K.; Ahmed, S.A. Geospatial technology for delineating groundwater potential zones in Doddahalla watershed of Chitradurga district, India. Egypt. J. Remote Sens. Space Sci. 2016, 19, 223–234. [Google Scholar] [CrossRef] [Green Version]
  2. Nampak, H.; Pradhan, B.; Manap, M.A. Application of GIS based data driven evidential belief function model to predict groundwater potential zonation. J. Hydrol. 2014, 513, 283–300. [Google Scholar] [CrossRef]
  3. Ahmad, I.; Dar, M.A.; Andualem, T.G.; Teka, A.H.; Tolosa, A.T. GIS-Based Multi-criteria Evaluation for Deciphering of Groundwater Potential. J. Indian Soc. Remote Sens. 2019, 48, 305–313. [Google Scholar] [CrossRef]
  4. Andualem, T.G.; Demeke, G.G. Groundwater potential assessment using GIS and remote sensing: A case study of Guna tana landscape, upper blue Nile Basin, Ethiopia. J. Hydrol. Reg. Stud. 2019, 24, 100610. [Google Scholar] [CrossRef]
  5. Jha, M.K.; Chowdary, V.M.; Kulkarni, Y.; Mal, B.C. Rainwater harvesting planning using geospatial techniques and multicriteria decision analysis. Resour. Conserv. Recycl. 2014, 83, 96–111. [Google Scholar] [CrossRef]
  6. Jha, M.K.; Chowdary, V.M.; Chowdhury, A. Groundwater assessment in Salboni Block, West Bengal (India) using remote sensing, geographical information system and multi-criteria decision analysis techniques. Hydrogeol. J. 2010, 18, 1713–1728. [Google Scholar] [CrossRef]
  7. Nhamo, L.; Yimer, G.; Mabhaudhi, T.; Mpandeli, S.; Magombeyi, M.; Chitakira, M.; Magidi, J. An assessment of groundwater use in irrigated agriculture using multi-spectral remote sensing. Phys. Chem. Earth 2019, 115, 102810. [Google Scholar] [CrossRef]
  8. Shao, Z.; Huq, E.; Cai, B.; Altan, O.; Li, Y. Integrated remote sensing and GIS approach using Fuzzy-AHP to delineate and identify groundwater potential zones in semi-arid Shanxi. Environ. Model. Softw. 2020, 134, 104868. [Google Scholar] [CrossRef]
  9. Patra, S.; Mishra, P.; Mahapatra, S.C. Delineation of Groundwater Potential Zone for Sustainable Development: A Case Study from Ganga Alluvial Plain Covering Hooghly District of India using Remote Sensing, Geographic Information System and Analytic Hierarchy Process. J. Clean. Prod. 2017, 172, 2485–2502. [Google Scholar] [CrossRef]
  10. Das, B.; Pal, S.C.; Malik, S.; Chakrabortty, R. Modeling groundwater potential zones of Puruliya district, West Bengal, India using remote sensing and GIS techniques. Geol. Ecol. Landsc. 2019, 3, 223–237. [Google Scholar] [CrossRef] [Green Version]
  11. Alahacoon, N.; Edirisinghe, M.; Ranagalage, M. Satellite-based meteorological and agricultural drought monitoring for agricultural sustainability in Sri Lanka. Sustainability 2021, 13, 3427. [Google Scholar] [CrossRef]
  12. Kumar, T.; Gautam, A.K.; Kumar, T. Appraising the accuracy of GIS-based Multi-criteria decision making technique for delineation of Groundwater potential zones. Water Resour. Manag. 2014, 28, 4449–4466. [Google Scholar] [CrossRef]
  13. Villholth, K.G.; Rajasooriyar, L.D. Groundwater Resources and Management Challenges in Sri Lanka—An Overview. Water Resour. Manag. 2010, 24, 1489–1513. [Google Scholar] [CrossRef]
  14. Panabokke, C.; Perera, A.P.G.R.L. Groundwater Resources of Sri Lanka; Water Resource Board Sri Lanka: Colomboi, Sri Lanka, 2005.
  15. World Bank. World Development Indicators: Fresh Water; The Word Bank Group: Washington, DC, USA, 2014. [Google Scholar]
  16. Buzinde, C.N.; Manuel-Navarrete, D.; Yoo, E.E.; Morais, D. Tourists’ perceptions in a climate of change: Eroding Destinations. Ann. Tour. Res. 2010, 37, 333–354. [Google Scholar] [CrossRef]
  17. Aslan, V.; Çelik, R. Integrated gis-based multi-criteria analysis for groundwater potential mapping in the euphrates’s sub-basin, harran basin, turkey. Sustainability 2021, 13, 7375. [Google Scholar] [CrossRef]
  18. Arabadzhyan, A.; Figini, P.; García, C.; González, M.M.; Lam-González, Y.E.; León, C.J. Climate change, coastal tourism, and impact chains–a literature review. Curr. Issues Tour. 2020, 24, 2233–2268. [Google Scholar] [CrossRef]
  19. Kumari, M.K.N.; Sakai, K.; Kimura, S.; Yuge, K.; Gunarathna, M.H.J.P. Classification of groundwater suitability for irrigation in the ulagalla tank cascade landscape by GIS and the analytic hierarchy process. Agronomy 2019, 9, 351. [Google Scholar] [CrossRef] [Green Version]
  20. Hettiarachchi, I. A review on ground water management issues in the dry zone of Sri Lanka. In Proceedings of the Third International Scientific Conference BALWOIS 2008, Ohrid, Macedonia, 27–31 May 2008; pp. 27–31. [Google Scholar]
  21. Pankaj, K.; Herath, S.; Avtar, R.; Takeuchi, K. Mapping of groundwater potential zones in Killinochi area, Sri Lanka, using GIS and remote sensing techniques. Sustain. Water Resour. Manag. 2016, 2, 419–430. [Google Scholar] [CrossRef] [Green Version]
  22. De Silva, S.; Aheeyar, M.; Arulingam, I. The New Water: Opportunities and Challenges of the Rise to Prominence of Groundwater in Sri Lanka in the Face of Socioeconomic and Climatic Change. In Groundwater of South Asia; Mukherjee, A., Ed.; Springer: Singapore, 2018; pp. 759–799. ISBN 9789811038891. [Google Scholar]
  23. Gunaalan, K.; Ranagalage, M.; Gunarathna, M.H.J.P.; Kumari, M.K.N.; Vithanage, M.; Srivaratharasan, T.; Saravanan, S.; Warnasuriya, T.W.S. Application of geospatial techniques for groundwater quality and availability assessment: A case study in Jaffna Peninsula, Sri Lanka. ISPRS Int. J. Geo-Inf. 2018, 7, 20. [Google Scholar] [CrossRef] [Green Version]
  24. Herath, G. Overview of Groundwater Management, the Agrowell Program, and the Impact of the 2004 Tsunami in Sri Lanka. Int. Rev. Environ. Strateg. 2006, 6, 373–386. [Google Scholar]
  25. Climate Change Secretariat. Sector Vulnerability Profile: Water. Supplementary Document to: The National Climate Change Adaptation Strategy for Sri Lanka 2011 to 2016; Ministry of Environment: Colombo, Sri Lanka, 2010.
  26. District Secretariat Kilinochchi. Statistical Hand Book-2020; District Secretariat Kilinochchi: Kilinochchi, Sri Lanka, 2020.
  27. Alahacoon, N.; Edirisinghe, M. Spatial variability of rainfall trends in sri lanka from 1989 to 2019 as an indication of climate change. ISPRS Int. J. Geo-Inf. 2021, 10, 84. [Google Scholar] [CrossRef]
  28. Gunarathna, M.H.J.P.; Nirmanee, K.G.S.; Kumari, M.K.N. Geostatistical analysis of spatial and seasonal variation of groundwater level: A comprehensive study in Malwathu Oya cascade-I, I, Anuradhapura, Sri Lanka. Int. Res. J. Environ. Sci. 2016, 5, 29–36. [Google Scholar]
  29. Amarasinghe, U.; Mutuwatta, L.; Sakthivadive, R. Water Scarcity Variations within a Country: A Case Study of Sri Lanka-Research Report 32; International Water Management Institute: Anand, India, 1999. [Google Scholar]
  30. Allafta, H.; Opp, C. Identification of Groundwater Potential Zones Using Remote Sensing and GIS Techniques: A Case Study of the Shatt Al-Arab Basin. Remote Sens. 2021, 13, 112. [Google Scholar] [CrossRef]
  31. Arefin, R. Groundwater for Sustainable Development Groundwater potential zone identification at Plio-Pleistocene elevated tract, Bangladesh: AHP-GIS and remote sensing approach. Groundw. Sustain. Dev. 2020, 10, 100340. [Google Scholar] [CrossRef]
  32. Achu, A.L.; Thomas, J.; Reghunath, R. Groundwater for Sustainable Development Multi-criteria decision analysis for delineation of groundwater potential zones in a tropical river basin using remote sensing, GIS and analytical hierarchy process (AHP). Groundw. Sustain. Dev. 2020, 10, 100365. [Google Scholar] [CrossRef]
  33. Aluko, O.E.; Igwe, O. An integrated geomatics approach to groundwater potential delineation in the Akoko-Edo Area, Nigeria. Environ. Earth Sci. 2017, 76, 240. [Google Scholar] [CrossRef]
  34. Agarwal, R.; Garg, P.K. Remote Sensing and GIS Based Groundwater Potential & Recharge Zones Mapping Using Multi-Criteria Decision Making Technique. Water Resour. Manag. 2015, 30, 243–260. [Google Scholar] [CrossRef]
  35. Yıldırım, Ü. Identification of Groundwater Potential Zones Using GIS and Multi-Criteria Decision-Making Techniques: A Case Study Upper Coruh River Basin (NE Turkey). ISPRS Int. J. Geo-Inf. 2021, 10, 396. [Google Scholar] [CrossRef]
  36. Nasir, M.J.; Khan, S.; Ayaz, T.; Khan, A.Z.; Ahmad, W.; Lei, M. An integrated geospatial multi-influencing factor approach to delineate and identify groundwater potential zones in Kabul Province, Afghanistan. Environ. Earth Sci. 2021, 80, 453. [Google Scholar] [CrossRef]
  37. Kumar, M.; Singh, P.; Singh, P.; Region, C. Fuzzy AHP based GIS and remote sensing techniques for the groundwater potential zonation for Bundelkhand Craton Region, India Fuzzy AHP based GIS and remote sensing techniques for. Geocarto Int. 2021, 1, 1–24. [Google Scholar] [CrossRef]
  38. Khan, U.; Faheem, H.; Jiang, Z.; Wajid, M.; Younas, M.; Zhang, B. Integrating a gis-based multi-influence factors model with hydro-geophysical exploration for groundwater potential and hydrogeological assessment: A case study in the Karak Watershed, Northern Pakistan. Water 2021, 13, 1255. [Google Scholar] [CrossRef]
  39. Karimi-Rizvandi, S.; Goodarzi, H.V.; Afkoueieh, J.H.; Chung, I.M.; Kisi, O.; Kim, S.; Linh, N.T.T. Groundwater-potential mapping using a self-learning bayesian network model: A comparison among metaheuristic algorithms. Water 2021, 13, 658. [Google Scholar] [CrossRef]
  40. Jhariya, D.C.; Mondal, K.C.; Kumar, T.; Indhulekha, K.; Khan, R.; Singh, V.K. Assessment of groundwater potential zone using GIS-based multi-influencing factor (MIF), multi-criteria decision analysis (MCDA) and electrical resistivity survey techniques in Raipur city, Chhattisgarh, India. Aqua Water Infrastruct. Ecosyst. Soc. 2021, 70, 375–400. [Google Scholar] [CrossRef]
  41. Doke, A.B.; Zolekar, R.B.; Patel, H.; Das, S. Geospatial mapping of groundwater potential zones using multi-criteria decision-making AHP approach in a hardrock basaltic terrain in India. Ecol. Indic. 2021, 127, 107685. [Google Scholar] [CrossRef]
  42. Becken, S.; Hay, J. Tourism and Climate Change: Risks and Opportunities; Channel View Publications: Toronto, ON, Canada, 2007; ISBN 9781845410674. [Google Scholar]
  43. Aburas, M.M.; Abdullah, S.H.O.; Ramli, M.F.; Asha’Ari, Z.H. Land Suitability Analysis of Urban Growth in Seremban Malaysia, Using GIS Based Analytical Hierarchy Process. Procedia Eng. 2017, 198, 1128–1136. [Google Scholar] [CrossRef]
  44. Abijith, D.; Saravanan, S.; Singh, L.; Jacinth, J.; Saranya, T.; Parthasarathy, K.S.S. HydroResearch GIS-based multi-criteria analysis for identi fi cation of potential groundwater recharge zones—A case study from Ponnaniyaru watershed, Tamil Nadu, India. HydroResearch 2020, 3, 1–14. [Google Scholar] [CrossRef]
  45. Forootan, E.; Seyedi, F. GIS-based multi-criteria decision making and entropy approaches for groundwater potential zones delineation. Earth Sci. Inform. 2021, 14, 333–347. [Google Scholar] [CrossRef]
  46. Silwal, C.B.; Pathak, D. Review on practices and state of the art methods on delineation of ground water potential using GIS and remote sensing. Bull. Dep. Geol. 2018, 20, 7–20. [Google Scholar] [CrossRef] [Green Version]
  47. Ahmad, I.; Ahmad, M.; Halefom, A.; Teshome, M.; Gebrie, T.; Teshome, A.; Shafi, T. Journal of African Earth Sciences GIS and fuzzy logic techniques-based demarcation of groundwater potential zones: A case study from Jemma River basin, Ethiopia. J. Afr. Earth Sci. 2020, 169, 103860. [Google Scholar] [CrossRef]
  48. Lentswe, G.B.; Molwalefhe, L. Journal of Hydrology: Regional Studies Delineation of potential groundwater recharge zones using analytic hierarchy process-guided GIS in the semi-arid Motloutse watershed, eastern Botswana. J. Hydrol. Reg. Stud. 2020, 28, 100674. [Google Scholar] [CrossRef]
  49. Dilekoglu, M.F.; Aslan, V. Determination of groundwater potential distribution of Ceylanpinar Plain (Turkey) in Upper Mesopotamia by using geographical information techniques and Fuzzy-AHP with MCDM. Water Supply 2021, 1, 1–19. [Google Scholar] [CrossRef]
  50. Ajay Kumar, V.; Mondal, N.C.; Ahmed, S. Identification of Groundwater Potential Zones Using RS, GIS and AHP Techniques: A Case Study in a Part of Deccan Volcanic Province (DVP), Maharashtra, India. J. Indian Soc. Remote Sens. 2020, 48, 497–511. [Google Scholar] [CrossRef]
  51. Azma, A.; Narreie, E.; Shojaaddini, A.; Kianfar, N.; Kiyanfar, R.; Alizadeh, S.M.S.; Davarpanah, A. Statistical modeling for spatial groundwater potential map based on gis technique. Sustainability 2021, 13, 3788. [Google Scholar] [CrossRef]
  52. Sarwar, A.; Ahmad, S.R.; Rehmani, M.I.A.; Asif Javid, M.; Gulzar, S.; Shehzad, M.A.; Dar, J.S.; Baazeem, A.; Iqbal, M.A.; Rahman, M.H.U.; et al. Mapping groundwater potential for irrigation, by geographical information system and remote sensing techniques: A case study of district lower dir, pakistan. Atmosphere 2021, 12, 669. [Google Scholar] [CrossRef]
  53. Elmahdy, S.; Ali, T.; Mohamed, M. Regional mapping of groundwater potential in ar rub al khali, arabian peninsula using the classification and regression trees model. Remote Sens. 2021, 13, 2300. [Google Scholar] [CrossRef]
  54. Ha, D.H.; Nguyen, P.T.; Costache, R.; Al-Ansari, N.; Phong, T.V.; Nguyen, H.D.; Amiri, M.; Sharma, R.; Prakash, I.; Le, H.V.; et al. Quadratic Discriminant Analysis Based Ensemble Machine Learning Models for Groundwater Potential Modeling and Mapping. Water Resour. Manag. 2021, 35, 4415–4433. [Google Scholar] [CrossRef]
  55. Souissi, D.; Msaddek, M.H.; Zouhri, L.; May, M.E.; Dlala, M. Mapping groundwater recharge potential zones in arid region using GIS and Landsat approaches, southeast Tunisia. Hydrol. Sci. J. 2018, 63, 251–268. [Google Scholar] [CrossRef]
  56. Arya, S.; Subramani, T.; Karunanidhi, D. Delineation of groundwater potential zones and recommendation of artificial recharge structures for augmentation of groundwater resources in Vattamalaikarai Basin, South India. Environ. Earth Sci. 2020, 79, 1–13. [Google Scholar] [CrossRef]
  57. Bhunia, G.S. An approach to demarcate groundwater recharge potential zone using geospatial technology. Appl. Water Sci. 2020, 10, 1–12. [Google Scholar] [CrossRef]
  58. Qadir, J.; Bhat, M.S.; Alam, A.; Rashid, I. Mapping groundwater potential zones using remote sensing and GIS approach in Jammu Himalaya, Jammu and Kashmir. GeoJournal 2020, 85, 487–504. [Google Scholar] [CrossRef]
  59. Makonyo, M.; Msabi, M.M. Remote Sensing Applications: Society and Environment Identification of groundwater potential recharge zones using GIS-based multi-criteria decision analysis: A case study of semi-arid midlands Manyara fractured aquifer, North-Eastern Tanzania. Remote Sens. Appl. Soc. Environ. 2021, 23, 100544. [Google Scholar] [CrossRef]
  60. Senanayake, I.P.; Dissanayake, D.M.D.O.K.; Mayadunna, B.B.; Weerasekera, W.L. An approach to delineate groundwater recharge potential sites in Ambalantota, Sri Lanka using GIS techniques. Geosci. Front. 2016, 7, 115–124. [Google Scholar] [CrossRef] [Green Version]
  61. District Secretariat Kilinochchi. Statistical Hand Book-2019; Chapter 01; District Secretariat Kilinochchi: Kilinochchi, Sri Lanka, 2019.
  62. Survey Department of Sri Lanka. Topographic Sheet No. 04,05,07,08,09; Survey Department of Sri Lanka: Colombo, Sri Lanka, 1970.
  63. Geological Survey and Mines Bureau of Sri Lanka. Geological Map of Sri Lanka; Geological Survey and Mines Bureau of Sri Lanka: Sri Jayawardenepura Kotte, Sri Lanka, 1982.
  64. Geological Survey and Mines Bureau of Sri Lanka. Geomorphological Map of Sri Lanka; Geological Survey and Mines Bureau of Sri Lanka: Sri Jayawardenepura Kotte, Sri Lanka, 1982.
  65. Department of Irrigation. Soil Map of Sri Lanka; Department of Cartography, ITC: Colombo, Sri Lanka, 1988. [Google Scholar]
  66. USGS United States Geological Survey (USGS). Available online: https://earthexplorer.usgs.gov/ (accessed on 10 February 2020).
  67. Lu, G.Y.; Wong, D.W. An adaptive inverse-distance weighting spatial interpolation technique. Comput. Geosci. 2008, 34, 1044–1055. [Google Scholar] [CrossRef]
  68. Chen, F.W.; Liu, C.W. Estimation of the spatial rainfall distribution using inverse distance weighting (IDW) in the middle of Taiwan. Paddy Water Environ. 2012, 10, 209–222. [Google Scholar] [CrossRef]
  69. Wijemannage, A.L.K.; Ranagalage, M.; Perera, E.N.C. Comparison of spatial interpolation methods for rainfall data over Sri Lanka. In Proceedings of the Asian Conference in Remote Sensing 2016, Colombo, Sri Lanka, 17–21 October 2016; pp. 1723–1732. [Google Scholar]
  70. Taylor, P.; Foody, G.M. Harshness in image classification accuracy assessment. Int. J. Remote 2008, 29, 37–41. [Google Scholar] [CrossRef] [Green Version]
  71. Verma, P.; Raghubanshi, A.; Srivastava, P.K. Appraisal of kappa—based metrics and disagreement indices of accuracy assessment for parametric and nonparametric techniques used in LULC classification and change detection. Model. Earth Syst. Environ. 2020, 6, 1045–1059. [Google Scholar] [CrossRef]
  72. Nithya, C.N.; Srinivas, Y.; Magesh, N.S.; Kaliraj, S. Assessment of groundwater potential zones in Chittar basin, Southern India using GIS based AHP technique. Remote Sens. Appl. Soc. Environ. 2019, 15, 100248. [Google Scholar] [CrossRef]
  73. Adeyeye, O.A.; Ikpokonte, E.A.; Arabi, S.A. GIS-based groundwater potential mapping within Dengi area, North Central Nigeria. Egypt. J. Remote Sens. Space Sci. 2019, 22, 175–181. [Google Scholar] [CrossRef]
  74. Rajasekhar, M.; Sudarsana Raju, G.; Sreenivasulu, Y.; Siddi Raju, R. Delineation of groundwater potential zones in semi-arid region of Jilledubanderu river basin, Anantapur District, Andhra Pradesh, India using fuzzy logic, AHP and integrated fuzzy-AHP approaches. HydroResearch 2019, 2, 97–108. [Google Scholar] [CrossRef]
  75. Das, B.; Pal, S.C. Combination of GIS and fuzzy-AHP for delineating groundwater recharge potential zones in the critical Goghat-II block of West Bengal, India. HydroResearch 2019, 2, 21–30. [Google Scholar] [CrossRef]
  76. Etikala, B.; Golla, V.; Li, P.; Renati, S. Deciphering groundwater potential zones using MIF technique and GIS: A study from Tirupati area, Chittoor District, Andhra Pradesh, India. HydroResearch 2019, 1, 1–7. [Google Scholar] [CrossRef]
  77. Chowdhury, A.; Jha, M.K.; Chowdary, V.M. Delineation of groundwater recharge zones and identification of artificial recharge sites in West Medinipur district, West Bengal, using RS, GIS and MCDM techniques. Environ. Earth Sci. 2010, 59, 1209–1222. [Google Scholar] [CrossRef]
  78. Saaty, T.L. The Analytic Hierarchy Process: Planning, Priority Setting, Resources Allocation; Mcgraw-Hill: New York, NY, USA, 1980. [Google Scholar]
  79. Saaty, T.L. A scaling method for priorities in hierarchical structures. J. Math. Psychol. 1977, 15, 234–281. [Google Scholar] [CrossRef]
  80. Indhulekha, K.; Mondal, K.C.; Jhariya, D.C. Groundwater prospect mapping using remote sensing, GIS and resistivity survey techniques in Chhokra Nala Raipur district, Chhattisgarh, India. J. Water Supply Res. Technol.-AQUA 2019, 68, 595–606. [Google Scholar] [CrossRef]
  81. Dissanayake, D.M.S.L.B.; Morimoto, T.; Murayama, Y.; Ranagalage, M.; Perera, E.N.C. Analysis of life quality in a tropical mountain city using a multi-criteria geospatial technique: A case study of Kandy city, Sri Lanka. Sustainability 2020, 12, 2918. [Google Scholar] [CrossRef] [Green Version]
  82. Rahmati, O.; Nazari Samani, A.; Mahdavi, M.; Pourghasemi, H.R.; Zeinivand, H. Groundwater potential mapping at Kurdistan region of Iran using analytic hierarchy process and GIS. Arab. J. Geosci. 2015, 8, 7059–7071. [Google Scholar] [CrossRef]
  83. Fashae, O.A.; Tijani, M.N.; Talabi, A.O.; Adedeji, O.I. Delineation of groundwater potential zones in the crystalline basement terrain of SW-Nigeria: An integrated GIS and remote sensing approach. Appl. Water Sci. 2014, 4, 19–38. [Google Scholar] [CrossRef] [Green Version]
  84. Benjmel, K.; Amraoui, F.; Boutaleb, S.; Ouchchen, M.; Tahiri, A.; Touab, A. Mapping of Groundwater Potential Zones in Crystalline Terrain Using Remote Sensing, GIS Techniques, and Multicriteria Data Analysis (Case of the Ighrem Region, Western Anti-Atlas, Morocco). Water 2020, 12, 471. [Google Scholar] [CrossRef] [Green Version]
  85. Shahinuzzaman, M.; Haque, M.N.; Shahid, S. Delineation of groundwater potential zones using a parsimonious concept based on catastrophe theory and analytical hierarchy process. Hydrogeol. J. 2021, 29, 1091–1116. [Google Scholar] [CrossRef]
  86. Krishnamurthy, J.; Srinivas, G. Role of geological and geomorphological factors in ground water exploration: A study using irs liss data. Int. J. Remote Sens. 1995, 16, 2595–2618. [Google Scholar] [CrossRef]
  87. Chakrabortty, R.; Pal, S.C.; Malik, S.; Das, B. Modeling and mapping of groundwater potentiality zones using AHP and GIS technique: A case study of Raniganj Block, Paschim Bardhaman, West Bengal. Model. Earth Syst. Environ. 2018, 4, 1085–1110. [Google Scholar] [CrossRef]
  88. Cooray, P.G. An Introduction to the Geology of Sri Lanka; Ceylon National Museum Publication: Colombo, Sri Lanka, 1967. [Google Scholar]
  89. Swan, B. An Introduction to the Coastal Geomorphology of Sri Lanka; The National Museums of Sri Lanka: Colombo, Sri Lanka, 1983. [Google Scholar]
  90. Guru, B.; Seshan, K.; Bera, S. Frequency ratio model for groundwater potential mapping and its sustainable management in cold desert, India. J. King Saud Univ.-Sci. 2017, 29, 333–347. [Google Scholar] [CrossRef] [Green Version]
  91. Thomas, B.C.; Kuriakose, S.L.; Jayadev, S.K. A method for groundwater prospect zonation in data poor areas using remote sensing and GIS: A case study in kalikavu panchayath of malappuram district, Kerala, India. Int. J. Digit. Earth 2009, 2, 155–170. [Google Scholar] [CrossRef]
  92. Ramya, A.N.; Senanayake, I.P. Identification of artificial groundwater recharges zones in Vavuniya district using Remote Sensing and GIS. Agriest 2019, 13, 44–55. [Google Scholar] [CrossRef]
  93. Satapathy, I.; Syed, T.H. Characterization of groundwater potential and artificial recharge sites in Bokaro District, Jharkhand (India), using remote sensing and GIS-based techniques. Environ. Earth Sci. 2015, 74, 4215–4232. [Google Scholar] [CrossRef]
  94. Senarathne, S.L.; Jayawardana, J.M.C.K.; Edirisinghe, E.A.N.V.; Chandrajith, R. Characterization of groundwater in Malala oya river basin, Sri Lanka using geochemical and isotope signatures. Groundw. Sustain. Dev. 2019, 9, 100225. [Google Scholar] [CrossRef]
  95. Harini, P.; Sahadevan, D.K.; Das, I.C.; Manikyamba, C.; Durgaprasad, M.; Nandan, M.J. Regional Groundwater Assessment of Krishna River Basin Using Integrated GIS Approach. J. Indian Soc. Remote Sens. 2018, 46, 1365–1377. [Google Scholar] [CrossRef]
  96. Jasrotia, A.S.; Majhi, A.; Singh, S. Water balance approach for rainwater harvesting using remote sensing and GIS techniques, Jammu Himalaya, India. Water Resour. Manag. 2009, 23, 3035–3055. [Google Scholar] [CrossRef]
  97. Magesh, N.S.; Chandrasekar, N.; Soundranayagam, J.P. Delineation of groundwater potential zones in Theni district, Tamil Nadu, using remote sensing, GIS and MIF techniques. Geosci. Front. 2012, 3, 189–196. [Google Scholar] [CrossRef] [Green Version]
  98. Varade, A.M.; Khare, Y.D.; Yadav, P.; Doad, A.P.; Das, S.; Kanetkar, M.; Golekar, R.B. ‘Lineaments’ the Potential Groundwater Zones in Hard Rock Area: A Case Study of Basaltic Terrain of WGKKC-2 Watershed from Kalmeswar Tehsil of Nagpur District, Central India. J. Indian Soc. Remote Sens. 2018, 46, 539–549. [Google Scholar] [CrossRef]
  99. Anderson, G.B.; Barnes, E.A.; Bell, M.L.; Dominici, F. The future of climate epidemiology: Opportunities for advancing health research in the context of climate change. Am. J. Epidemiol. 2019, 80523, 1–32. [Google Scholar] [CrossRef] [PubMed]
  100. Saha, S. Groundwater potential mapping using analytical hierarchical process: A study on Md. Bazar Block of Birbhum District, West Bengal. Spat. Inf. Res. 2017, 25, 615–626. [Google Scholar] [CrossRef]
  101. Serele, C.; Ana, P. Geoscience Frontiers Mapping of groundwater potential zones in the drought-prone areas of south Madagascar using geospatial techniques. Geosci. Front. 2019, 11, 1403–1413. [Google Scholar] [CrossRef]
  102. Dar, T.; Rai, N.; Bhat, A.; Dar, T. Delineation of potential groundwater recharge zones using analytical hierarchy process (AHP) hierarchy process (AHP). Geol. Ecol. Landsc. 2020, 1, 1–16. [Google Scholar] [CrossRef] [Green Version]
  103. Pal, S.; Kundu, S.; Mahato, S. Groundwater potential zones for sustainable management plans in a river basin of India and Bangladesh. J. Clean. Prod. 2020, 257, 120311. [Google Scholar] [CrossRef]
  104. Ranagalage, M.; Gunarathna, M.H.J.P.; Surasinghe, T.D.; Dissanayake, D.; Simwanda, M.; Murayama, Y.; Morimoto, T.; Phiri, D.; Nyirenda, V.R.; Premakantha, K.T.; et al. Multi-decadal forest-cover dynamics in the tropical realm: Past trends and policy insights for forest conservation in Dry Zone of Sri Lanka. Forests 2020, 11, 836. [Google Scholar] [CrossRef]
Figure 1. Location map of the study area: (a) Map of South Asia; (b) location of Sri Lanka; and (c) the extend of Kilinochchi district.
Ijgi 10 00730 g001
Figure 2. Flowchart of integration of RS-GIS and AHP techniques.
Ijgi 10 00730 g002
Figure 3. Flowchart of the methodology used for delineating potential groundwater zones (Stage 1—Data collection, Stage 2—Creation of geospatial maps, Stage 3—Weight assignment, Stage 4—Creation of potential groundwater zone, Stage 5—Validation of developed groundwater potential zones).
Ijgi 10 00730 g003
Figure 4. Geology map of Kilinochchi District.
Ijgi 10 00730 g004
Figure 5. Geomorphology map of Kilinochchi District.
Ijgi 10 00730 g005
Figure 6. Slope map of Kilinochchi District.
Ijgi 10 00730 g006
Figure 7. Soil map of Kilinochchi District.
Ijgi 10 00730 g007
Figure 8. Drainage density map of Kilinochchi District.
Ijgi 10 00730 g008
Figure 9. Lineament density map of Kilinochchi District.
Ijgi 10 00730 g009
Figure 10. Rainfall distribution map of Kilinochchi District.
Ijgi 10 00730 g010
Figure 11. Map of land use/land cover of Kilinochchi District.
Ijgi 10 00730 g011
Figure 12. Map of groundwater potential zones of Kilinochchi District.
Ijgi 10 00730 g012
Figure 13. Validation well map of Kilinochchi District.
Ijgi 10 00730 g013
Figure 14. Receiver Operating Characteristics (ROC) curve.
Ijgi 10 00730 g014
Table 1. A summary of thematic layers used in the selected literature review to delineate groundwater potential zones.
AuthorsSlLuGeRfSoLdDdGmLiTWiDgSPiElCuIfAlDrAq
Forootan and Seyedi, [45]xxxxxx xx
Doke et al., [41]x xxxxxx x
Karimi-Rizvandi et al., [39]xx xx x xx x xx
Aslan and Çelik, [17]xxxxxxxx x
Jhariya et al., [40]xxxxxxxx
Sarwar et al., [52]xxxxxxx
Nasir et al., [36]xxxxxxx
Kumar et al., [37]xxxxxxx xx x
Dilekoglu and Aslan, [49]xxxxx x xx x
Khan et al., [38]xxxxxxx x x
Abijith et al., [44]xxxxxxxx
Achu et al., [32]xx xxxxx
Ajay Kumar et al., [50]xxx xxxx
Ahmad et al., [47]xxx xxx x x
Arefin, [31]xx xxxxxx x x
Arya et al., [56]xxxxxxxx xx
Bhunia, [57] x x xxx x x
Qadir et al., [58]xxx xx x
Lentswe and Molwalefhe, [48]x xxx x
Sl—Slope, Lu—Land use, Ge—Geology, Li—Lithology, Gm—Geomorphology, Rf—Rainfall, SPi—Stream Power Index, El—Elevation, So—Soil, Ld—lineament density, Rd—River density, If—Infiltration TWi—Topographic wetness index, STi—Sediment transport index, Cu—Curvature, Dd—Drainage density, Al—Altitude, Dr—Distance from the river, Aq—Aquifer, Dg—Depth to groundwater.
Table 2. List of data layers and their sources.
ElementsDataSpatial ResolutionSource
Administrative boundary of Kilinochchi districtTopographic sheet No. 04, 05, 07, 08, 091:50,000Survey Department of Sri Lanka [62]
Geology MapGeological Map of Sri Lanka1:100,000Geological Survey and Mines Bureau of Sri Lanka [63]
Geomorphology MapGeomorphological Map of Sri Lanka1:100,000Geological Survey and Mines Bureau of Sri Lanka [64]
Soil MapSoil Map of Sri Lanka1:100,000Department of Irrigation [65]
Slope MapASTER GDEM30 mUnited States Geological Survey [66]
Map of drainage densityASTER GDEM30 mUnited States Geological Survey [66]
Lineament MapASTER GDEM30 mUnited States Geological Survey [66]
Land Use and Land CoverSentinel-210 mUnited States Geological Survey [66]
Map of RainfallRainfall data The Statistical Handbook 2019 of District Secretariat, Kilinochchi, Sri Lanka [61]
Table 3. Pairwise comparison matrix for the AHP process.
ThemeTheme
RfGeGmStLuSpLdDd
Rainfall (Rf)1.002.003.004.003.005.006.008.00
Geology (Ge)0.501.002.003.002.005.006.007.00
Geomorphology (Gm)0.330.501.002.002.005.006.007.00
Soil type (St)0.250.330.501.002.003.007.008.00
LULC (Lu)0.330.500.500.501.007.005.008.00
Slope (Sp)0.200.200.200.330.141.000.334.00
Lineament Density (Ld)0.170.170.170.140.203.001.002.00
Drainage Density (Dd)0.130.140.140.130.130.250.501.00
Table 4. Determining the normalized weights for thematic layers.
ThemeThemeNormalized Weight (W)Percentage Influenced
RfGeGmStLuSpLdDd
Rainfall (Rf)0.340.410.400.360.290.170.190.180.2929
Geology (Ge)0.170.210.270.270.190.170.190.160.2020
Geomorphology (Gm)0.110.100.130.180.190.170.190.160.1515
Soil type (St)0.090.070.070.090.190.100.220.180.1313
LULC (Lu)0.110.100.070.050.100.240.160.180.1212
Slope (Sp)0.070.040.030.030.010.030.010.090.044
Lineament Density (Ld)0.060.030.020.010.020.100.030.040.044
Drainage Density (Dd)0.040.030.020.010.010.010.020.020.022
CI = 0.123, n = 8, RI = 1.4, λmax = 8.86. Consistency Ratio (CR) = 0.088 < 0.1.
Table 5. Assigned and normalized weights of different features of thematic layers for potential groundwater zoning.
Thematic LayersFeature/ClassesAssigned RankGroundwater
Prospects
Feature Normalized Weight (wi)
Rainfall (mm/yr)<971Very Low0.067
97–1002Low0.133
100–1033Moderate0.2
103–1064High0.267
>1065Very High0.333
Total15
LithologyAlluvial and lagoonal clay, silt sand3Moderate0.2
Beach and dune sand4High0.267
Jaffna limestone, Minihagalkanda Beds5Very High0.333
Red earth, red and brown sand2Low0.133
Undifferentiated Vijayan gneiss with trend lines1Very Low0.067
Total15
GeomorphologyBeach ridges, bars and spits3Moderate0.200
Low plantation surface with inselbergs and thin soil (dry zone)4High0.267
River plains and adjacent coastal lowlands2Low0.133
Upwarped Pleistocence coastal plain1Very Low0.067
Plateau of Miocene limestones5Very High0.333
Total15
Slope (Degree)<0.55Very High0.333
0.5–14High0.267
1–1.53Moderate0.2
1.5–22Low0.133
>21Very Low0.067
Total15
Lineament (km/km2)<0.081Very Low0.067
0.08–0.232Low0.133
0.23–0.413Moderate0.2
0.41–0.624High0.267
>0.625Very High0.333
Total15
Drainage (km/km2)<28.475Very High0.333
28.47–56.944High0.267
56.94–85.423Moderate0.200
85.42–113.892Low0.133
>113.891Very Low0.067
Total15
LC/LUForest4High0.267
Agriculture and fallow land3Moderate0.200
Bare land2Low0.133
Settlements1Very Low0.067
Water bodies5Very High0.333
Total15
SoilAlkali and saline soils of variable texture (Solodized solonets and solonchaks)4High0.308
Alluvial soils of variable texture3Moderate0.231
Red-Yellow Podzolic soils2Low0.154
Red-Yellow latosols1Very Low0.077
Sand regosols on recent beach and dune sands5Very High0.231
Total15
Table 6. Groundwater potential region.
CategoriesArea km2Area (%)
Very Low59.125
Low207.7817
Moderate309.8926
High507.7442
Very High111.269
Publisher’s Note: MDPI stays neutral with regard to jurisdictional claims in published maps and institutional affiliations.

